Is It Time to Buy TON? Toncoin Price Surges 4.5% to $6.81 Following Major Partnerships

Cryptocurrency trading is speculative and your capital is at risk when you trade. We may earn affiliate commissions from some of the products on this page - at no extra cost to you.

The Toncoin price has surged 4.5% in the last 24 hours to trade at $6.81 as of 10:19 a.m. EST, on a 159.2% pump in trading volume to $611 million. The market cap is now at $17 billion. This surge comes as recent partnerships in the past week. On August 14th, the TON Foundation launched TON Ventures, a $40 million fund to support new projects on the TON blockchain, likely attracting developers and boosting network growth.
Will The Altcoin $TON Price Surpass $8?
Advertisement
The 4-hour chart shows a streak of seven bullish candles, indicating a strong recovery run for the Toncoin price. Further, the native token of The Open Network (TON) by Telegram has increased by 8.61% in the last 24 hours. The market cap… pic.twitter.com/LgbrJdDkbT
— Vlad Hryniv (@hryniv_vlad) August 19, 2024

Additionally, TON’s integration with the decentralized finance (DeFi) protocol Injective on the same day allows TON-based assets to be utilized within Injective’s ecosystem, potentially driving greater adoption in the DeFi sector. While most cryptocurrencies experienced a collective 3% decline, TON stood out by diverging strongly from the overall market trend, according to TradingView.
Toncoin price surge can also be attributed to a “bump-and-run reversal” (BARR) pattern, a well-known technical indicator in financial markets. This pattern unfolds in three stages: a gradual decline, a sharp drop, and a recovery that leads to a breakout. TON’s price action mirrored this sequence precisely.
On August 18th, Toncoin entered the final “run” phase of the BARR pattern, breaking above a critical downtrend line. This breakout was accompanied by a significant increase in trading volume, signaling strong buying interest.
Toncoin Price Statistics
- Toncoin price: $6.81
- Market cap: $17 billion
- Trading volume: $611 million
- Circulating supply: 2.5 billion
- Total supply: 5.1 billion
Toncoin Bulls Manage to Break Above the Bearish Channel
The Toncoin price has been experiencing a steady downward trend caused by the bears up to the lower trend line of the bearish channel, setting the $5.4129 support zone. After the price approached the support zone, the bulls regained momentum by making a bullish breakout at the upper trend line of the bearish channel. This movement has indicated an upcoming bullish crossover.
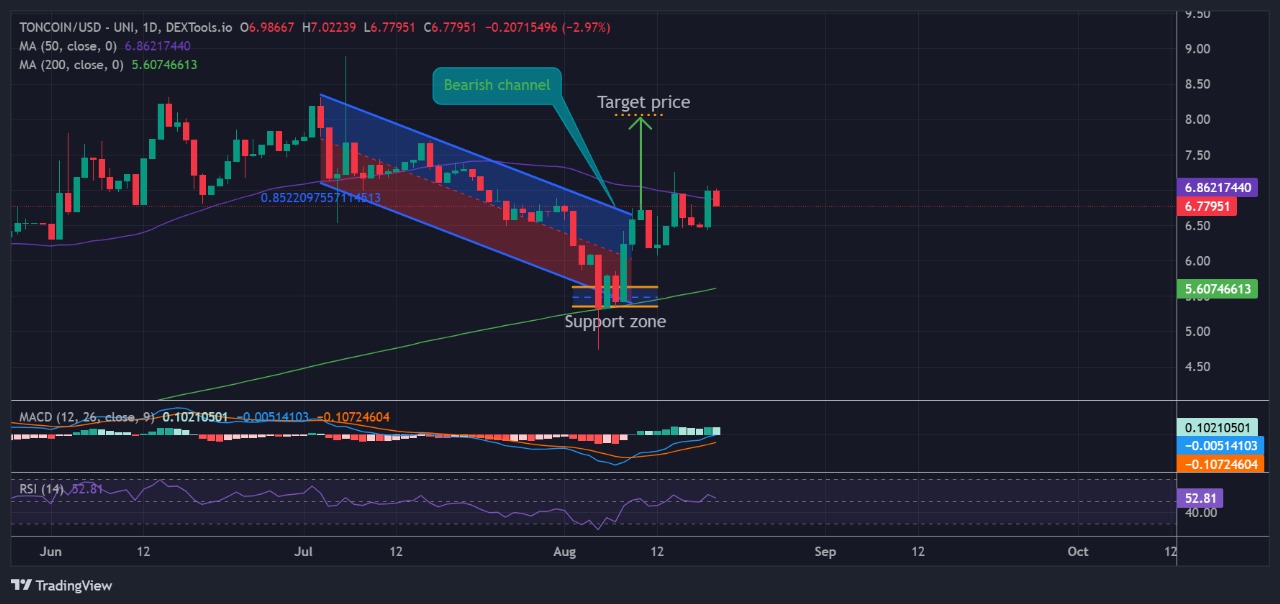
Toncoin’s price is currently trading above the 200-day simple moving average, making it a critical support level and, in turn, giving some hope for a bullish breakout. The Toncoin price is on track to ultimately surpass the 50-day (SMA) as it is seen to be flowing within the latest candlesticks. As soon as the Toncoin price crosses above the 50-day SMA, both SMAs will act as crucial support levels that will highly support the probability of a bullish crossover.
Toncoin Price Bullish on Technicals
The relative strength index (RSI) also indicates signs of a bull rally as it currently flows above the 50-midline level, signalling that the Toncoin price is still trading along the buyer’s side. Furthermore, the RSI continues to show signs of an upcoming bully rally, forming a slight curve to prevent itself from declining below the 50-midline level.
The moving average convergence divergence (MACD) also supports the likelihood of a bullish outlook. The blue line has surpassed the orange, aiming to cross the neutral line, signaling strong bullish sentiment and upward momentum. Also, the green histogram supports the possibility of an upcoming bully rally as bullies are increasing in size and number. If the blue line of MACD crosses the neutral line, the market will favor buyers highly.
If bulls sustain momentum and surpass the 200-day SMA, they increase the likelihood of a rally, potentially targeting $8.12. On the other hand, if the bears regain control of the Toncoin price, they will decline to $5.35082, which will favor the sellers.
Advertisement


