Is It Time to Buy DOGE? Dogecoin Price Signals Potential Rebound Amidst Market Volatility

Cryptocurrency trading is speculative and your capital is at risk when you trade. We may earn affiliate commissions from some of the products on this page - at no extra cost to you.

In the past 24 hours, DogeCoin has surged by 2.2% to trade at $0.01352, with a 32.6 surge in trading volume to $457 million. Its market cap stands at $18 billion.
Despite Dogecoin (DOGE) facing volatility and negative market sentiment recently, indications are suggesting a potential opportunity for buyers. Analyst Ali Martinez pointed out in a recent post that DOGE has shown signs of a potential turnaround.
Advertisement

The TD Sequential presents a buy signal on the #Dogecoin 3-day chart, predicting a rebound of one to four candlesticks for $DOGE! pic.twitter.com/elT1hc21vq
— Ali (@ali_charts) June 30, 2024
According to Martinez, the TD Sequential indicator on the three-day chart has signaled a buying opportunity. This indicator suggests a possible reversal soon, potentially paving the way for DOGE to target higher price levels, such as the important $0.15 threshold.
The TD Sequential indicator is widely used in technical analysis to spot potential shifts in market direction. When it gives a buy signal, it typically indicates a potential upward movement over the next one to four three-day periods (or candlesticks).
Recently, Dogecoin (DOGE) has been experiencing a bearish trend since early June, marked by continuous red candlesticks that reflect ongoing selling pressure. Around June 24th, DOGE briefly found support near the $0.12 mark.
Dogecoin Price Statistics
- Dogecoin price: $0.01352
- Market Cap: $17.98Billion
- Trading Volume:$457.66Million
- Circulating Supply:144.93Billion
- Total Supply: 144.94Billion
Dogecoin Price Signals A Rebound
The Dogecoin price shows signs of a bullish trend reversal at the $0.1218 support level. The price has begun consolidating and forming a double-bottom pattern, which traders see as a bullish reversal signal. After dropping from the $0.2295 resistance level due to bearish pressure, the bulls are regaining control and encouraging more buys to kickstart a bullish rally.
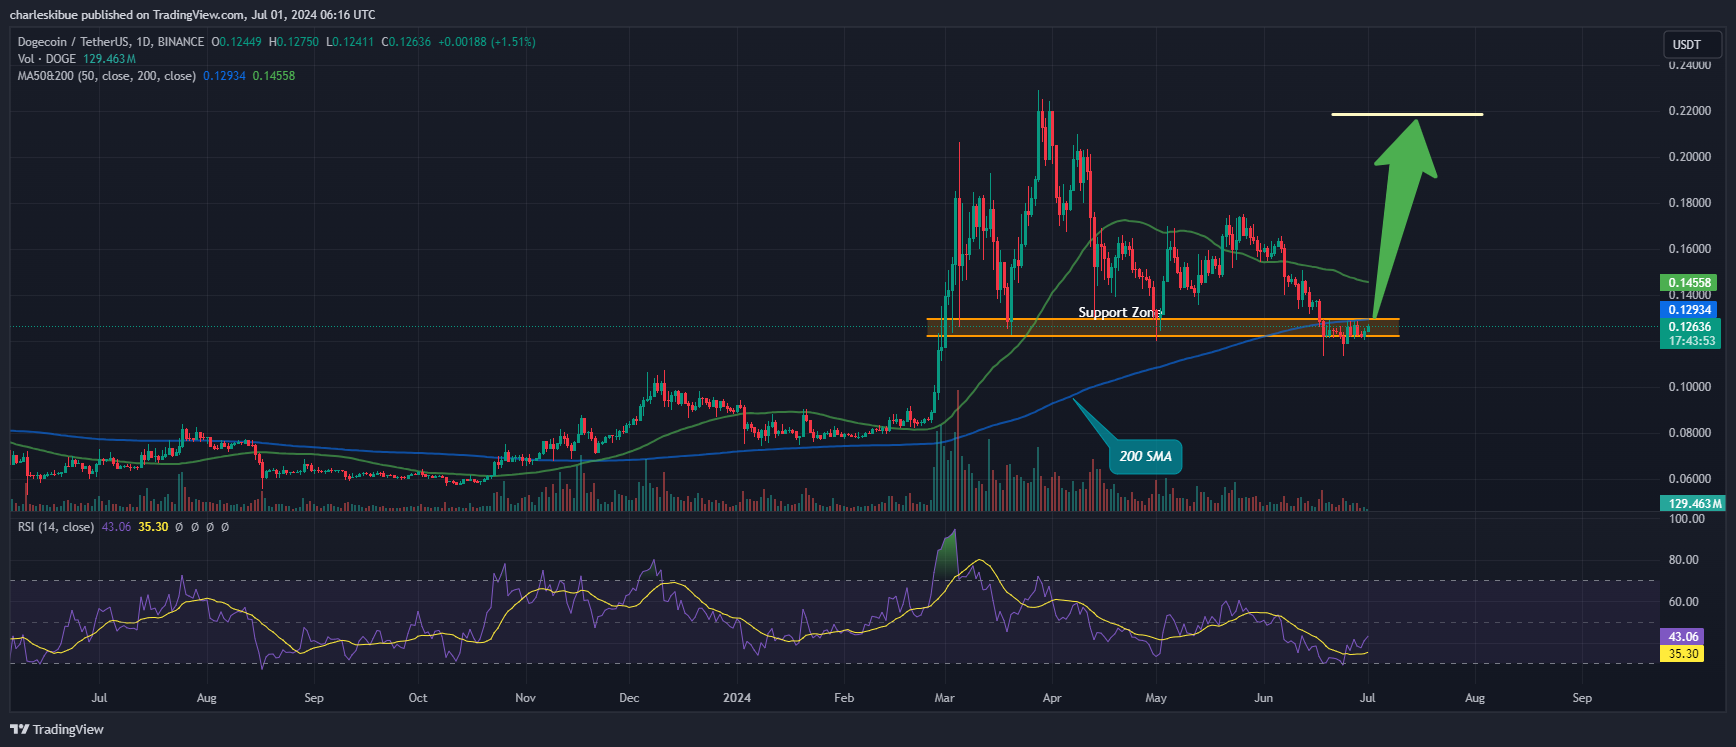
DOGEUSD Analysis (Source:Dextools.io)
Dogecoin is experiencing a resurgence, supported by optimistic investors who have maintained its price above the 200-day Simple Moving Average (SMA). There’s potential for further gains if the current upward momentum persists, potentially surpassing the 50-day SMA. Furthermore, the Relative Strength Index (RSI) is showing signs of recovery from oversold territory below 30. With ongoing momentum, the RSI could move towards the midpoint level of 50, indicating strengthening buying interest.
The MACD (Moving Average Convergence Divergence) is also signaling a bullish trend reversal, bouncing back from oversold levels near the neutral point. Notably, the blue MACD line has recently crossed above the orange signal line close to the neutral mark. Continued momentum could drive the MACD above the neutral level, confirming a robust bullish sentiment among traders and investors.
Dogecoin Price Prediction: Can DOGE Hit $1?
Dogecoin is aiming to reclaim its previous high of $0.2291, with bullish investors finding solid support near the 200-day Simple Moving Average (SMA).
Currently, there’s growing momentum around the $0.1218 support level, suggesting a potential move towards $0.2291 in the near future. Further upward momentum could also drive the price above the 50-day SMA, signaling a path to new highs. On the flip side, if bearish pressure persists, the price could drop below the $0.1220 support zone. This scenario might prompt bulls to regroup around the next support level, $0.1048.
The next hurdle for DOGE lies in surpassing the immediate resistance at $0.13. A breakthrough above this level would validate the buy signal highlighted earlier. If DOGE continues its upward trajectory, the next major target is $0.15. This level not only acts as a psychological barrier but also served as previous support that has now turned into resistance.
If bullish sentiment continues to strengthen, DOGE could potentially aim even higher, setting sights on $0.17. This level marks the starting point of the initial downtrend observed since early June.
Advertisement


