Is It Time to Buy BONK? Bonk Price Surges 20% on Binance.US Listing

Cryptocurrency trading is speculative and your capital is at risk when you trade. We may earn affiliate commissions from some of the products on this page - at no extra cost to you.

Highlights
- Bonk price has surged 20% in the last 24 hours on an 11% pump in trading volume to $3 billion
- The recent price surge of BONK follows its listing on Binance.US crypto exchange.
- Technical indicators suggest continued upward momentum, positioning BONK to approach its previous all-time high.
The Bonk price has surged 20% in the last 24 hours to trade at $0.00003839 as of 12 a.m. EST on an 11% pump in trading volume to $3 billion. The market capitalization now stands at $2.6 billion.
Advertisement

The recent price surge of BONK follows its listing on Binance.US, which has sparked significant interest and helped make BONK one of the market’s top-performing tokens. Since the listing, BONK’s price has been surging, driven by heightened trading activity and excitement over the new option to deposit BONK on the Solana network.
BREAKING: @BinanceUS LISTS SOLANA MEMECOIN $BONK (@bonk_inu) FOR SPOT TRADING pic.twitter.com/CDVwd7q37i
— DEGEN NEWS (@DegenerateNews) November 13, 2024
Binance.US, known for its low fees and attractive rewards, has drawn considerable attention to BONK with its addition. This listing represents a major milestone, boosting BONK’s accessibility and appeal among U.S. cryptocurrency traders.
BONK Statistics
- Bonk price: $0.00003839
- market capitalization: $2.6 billion
- Trading volume: $3 billion
- Circulating supply:92 trillion
- Total supply:92 trillion
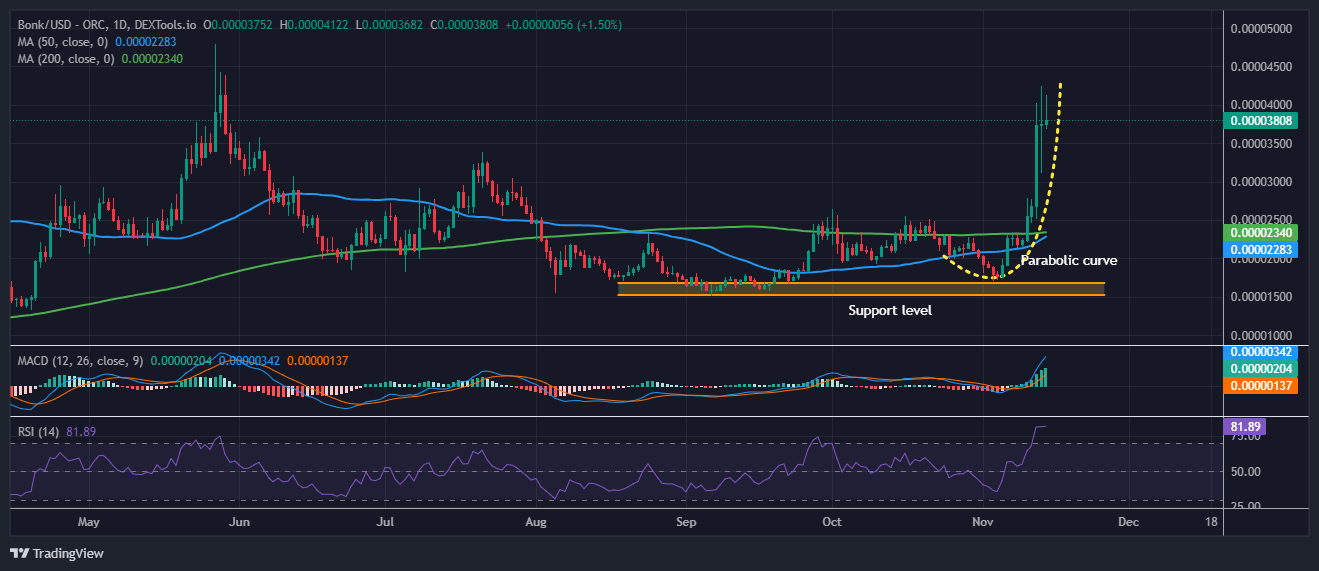
Bonk Price Spikes in a Parabolic Curve
The BONK/USD pair is currently trading around $0.00003808, exhibiting strong upward momentum. This rally appears to follow a parabolic curve, indicating steep bullish momentum. While this parabolic movement suggests strong buying interest, it may also signal that the price could become overextended, which might lead to a future correction.
The chart shows two key moving averages: the 50-day moving average (around $0.00002283) and the 200-day moving average (around $0.00002340). BONK/USD is trading well above both, which reinforces the bullish outlook. Additionally, the recent “golden cross,” where the 50-day MA crossed above the 200-day MA, is a bullish signal that typically points to continued upward movement. These moving averages now act as dynamic support levels, reinforcing the uptrend.
Bullish Technicals Signal More Uptrend
A strong support zone is highlighted between 0.00001500 and 0.00001750, which previously provided a foundation for the current rally. If the price pulls back from the current highs, this may act as a stabilizing level of support.
Also, the MACD is on the bullish side. The MACD line, while growing bars in the histogram, reflects the growth of momentum. Such a direction in trend means that buyers firmly keep control over the market. On the other hand, the RSI is 81.89- already in overbought territory above 70- meaning strong buying pressure but also possibly a short-term risk of pullback or consolidation.
The next resistance for BONK/USD might occur at $0.00004500, which could meet the point of a potential parabolic curve target. If it were to correct, the closest support levels may occur around the 50-day MA at 0.00002283 and 200-day MA at $0.00002340, while the area of key support was between 0.00001500 and $0.00001750.
Is a New ATH on the Horizon for Bonk Price?
Bonk’s recent surge in price indicates its strong market support, boosted by its listing on Binance.US. Indicators seem to give way to more upward movement; this positions BONK to approach its previous all-time high. Sustained positive sentiment may continue to drive further gains and add to trader interest.
Today, meme coins saw their prices surge by double-digit figures on the back of DOGE’s rally to a level not seen since 2021. On the other hand, Bitcoin’s all-time-high price of $92,000 has also woken up the broader cryptocurrency market. At this rate, BONK’s price could post its price at $0.000042 and might, with sustained bullish momentum, hike further to a new all-time high price of $0.00004704 or an increase of 10%.
Advertisement


