Is It Time To Buy BOME? Book of Meme Jumps 7% on Futures Open Interest Surge

Cryptocurrency trading is speculative and your capital is at risk when you trade. We may earn affiliate commissions from some of the products on this page - at no extra cost to you.

The Book of Meme price (BOME) has jumped 7% in the last 24 hours, as its recent price movement and technical indicators flash a bullish trend. At the time of writing, BOME/USD is trading at $0.009076, with its trading volume up by 60% to $220 million.
The renewed activity around BOME is also clear from its increasing futures open interest, which has risen to $60.25 million, up 14% over the past six days.
Advertisement

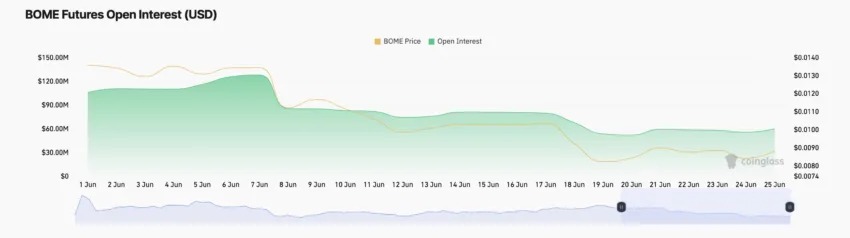
By introducing BOME perpetual contracts, traders can now speculate on its price movements without owning the coin, which could significantly impact its market dynamics.
Crypto analyst Mathew Dixon mentioned on X that BOME has significant potential for more aggressive gains. He cautioned, however, about the severe volatility associated with this asset. Dixon emphasized that BOME typically experiences an even stronger surge when the market rallies.
I mention #BOME regularly on the @ImpactMoney show and again today before this 16.6% pump in price.
Plenty of potential for more aggressive upside.
Beware of severe volatility but when the market rallies $BOME tends to rally MORE pic.twitter.com/QYgU6ApgCB— Matthew Dixon – CEO Evai (@mdtrade) June 27, 2024
Additionally, for $BOME to indicate that it has formed a low, it needs to complete five upward waves, with Wave-3 reaching $0.012. The recent price surge of the BOME memecoin is also linked to the Solana ETF filing.
Book Of Meme Price Spikes Above the Bearish Channel
The Book of Meme (BOME) has started to rebound following a prolonged period of decline in prices marked by a bearish wedge pattern. The chart indicates that BOME price bulls have regained momentum after a downturn that saw bears push the price down to the $0.008126 support zone. Additionally, the double bottom formation provided a boost for bulls to fly the price above the falling wedge.
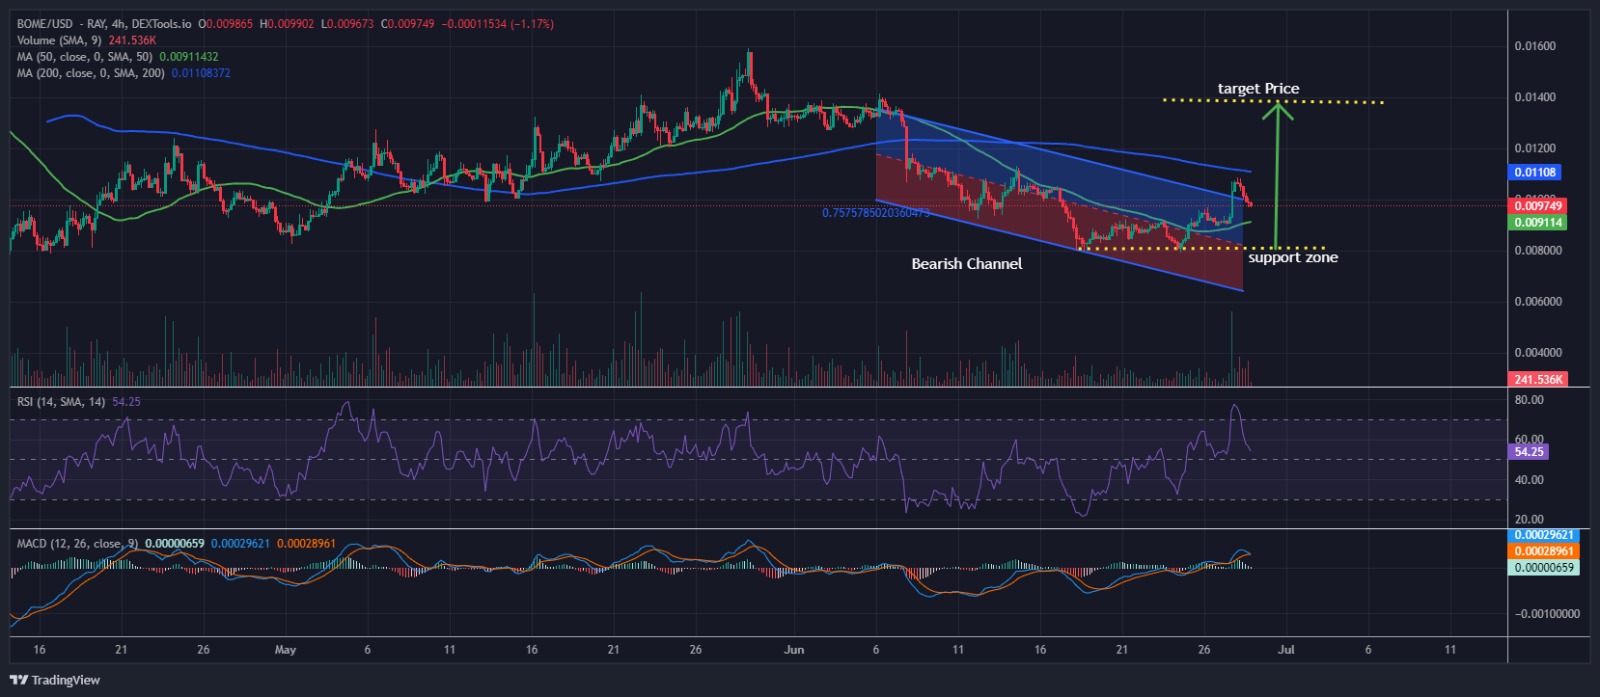
Though retracing, the price of BOME indicates a surge above the 50-day Simple Moving Average (SMA), breaking out of the bearish channel. This shift in momentum suggests an upward trend, with bulls driving the price higher in hopes of reaching a new all-time high. A further push could see the price surpassing the 200-day SMA, which is currently a significant resistance level.
The Relative Strength Index (RSI) also reflects this uptrend, having moved above the 50 midline level and approaching the 70 overbought zone. Currently sitting around 52 after a short retracement, the RSI still shows strong buying pressure. If this momentum continues, the RSI could enter the overbought zone above 70, signalling increased buying interest and reinforcing BOME’s bullish outlook.
The MACD (Moving Average Convergence Divergence) indicator also supports the bullish trend. The blue average line has crossed above the orange signal line at the neutral level, indicating a shift towards bullish momentum. Furthermore, the histogram bars show negative momentum in price movement, bolstering the positive sentiment for BOME.
Book Of Meme Price Prediction: More Upwards Ahead
BOME looks set to trade above the 200 SMA resistance despite a recent slight rebound. The bullish momentum has helped bulls push the price back above the falling channel, aiming for the previous high of $0.01310. If they can break through this level, the price could rise to $0.01390 in the coming days.
However, there’s a risk that bears could regain control, potentially driving the price down to the $0.01052 support zone, which aligns with the channel’s upper trendline. If this support level doesn’t hold, the price could fall further to the $0.009859 support zone.
Learn More
- Breaking: 21Shares Joins Race To Launch Spot Solana ETF
- DePIN Crypto Projects to Watch In 2024 – Top 10 DePIN Coins
- Best Metaverse Coins to Invest – Next Metaverse Coins

Advertisement


