Is It Time to Buy REEF? Reef Price Plunges 50% Despite VIA Labs Partnership Announcement


The Reef price plunged 50% in the last 24 hours to trade at $0.002202 as of 12:12 p.m. EST, 103% higher than the previous day’s trading volume of $336 million. The market cap is now $50 million.
This price drop comes despite the project’s announcement that it had begun work with VIA Labs and was also working on a reef bridge; its price plummeted. Last month, the team announced a partnership with VIA Labs to see Reef Chain integrated into its messaging, bridge, and Proto-CCTP products. The work was set to start in October, with a launch’s end.
Advertisement

It's a new — and big — milestone today! 🪙
The work has started: @via_labs has began building the bridge 🌉 🤝
Up, up, up we go 🚀 https://t.co/kG9E44NICw
— 🐠 Reef (@Reef_Chain) October 15, 2024
In the meantime, despite this price decline, REEF has recorded a spike in market volume by 103% in the last 24 hours to $336 million, which is majorly driven by exchanges like WhiteBit, HTX, KuCoin, and Bitget.
In addition, the number of REEF token holders has risen to almost 23,000. Some consider this price drop part of a possible “pump and dump” scheme; for other traders, like crypto analyst Guru Vedas, the current price is very promising for entry and predicts a bullish trend shortly.
Reef Statistics
- Reef price: $0.002202
- Market cap: $50 million
- Trading volume: $336 million
- Circulating supply: 22 billion
- Total supply: 22 billion
Reef Price Continues the Downtrend: Can the Bulls Recover?
The price of Reef has recently experienced an upward trend, signaling that traders have been benefiting from buying. All this is about to change since the upward trend has led to the formation of a bullish channel, indicating high chances for a bearish reversal. The bears have proven the prediction by regaining momentum at the $0.009722 resistance level located at the upper trend line of the bullish channel and forming a bearish breakout.
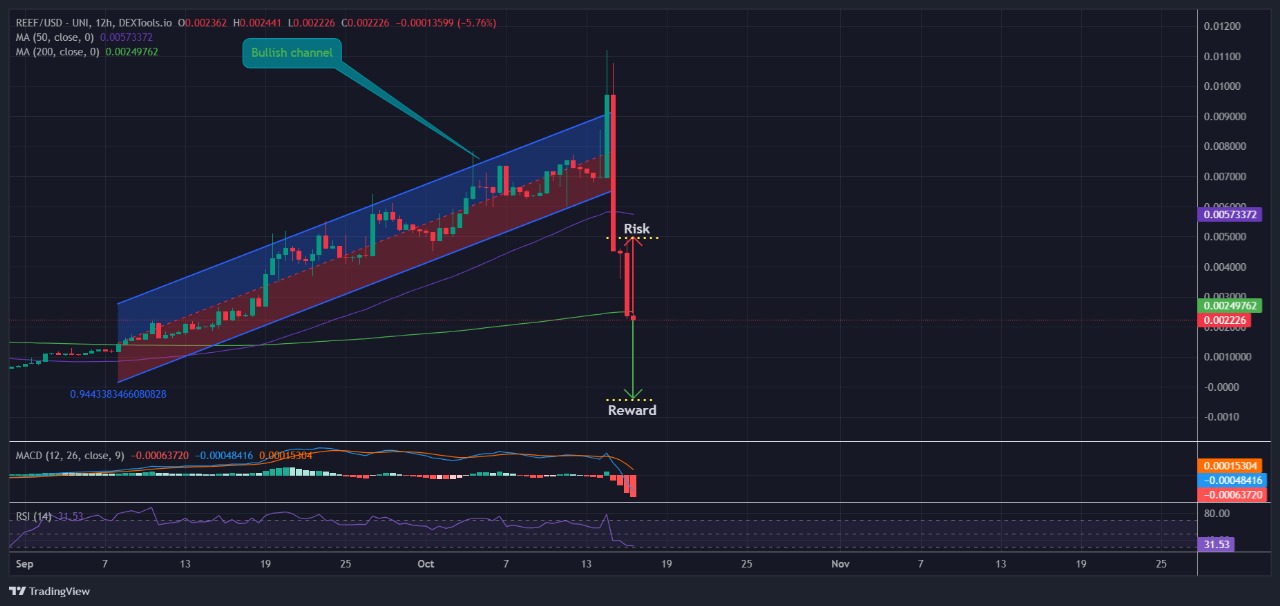
Technical analysis of Reef indicates a strong bearish trend, as the market is trading below the 50-day and 200-day simple moving averSMA’sSMA. This suggests the bears are in control. If this momentum continues, the distance between the prices could widen significantly, benefiting the sellers.
Bullish Reversal Ahead as Technicals Reach Oversold Levels
The relative strength index (RSI) also indicates a potential bearish trend. The RSI is dropping towards the 30-oversold levels, steadily aiming to create a new all-time (ATL). If this momentum is maintained, the market will reach the ATL.
Moving average convergence divergence (MACD) shows the possibility of an upcoming bearish trend since the orange signal line flows above the blue line of MACD. On the other hand, t, the red histogram bars are increasing in size and membership and maintaining the temporal intensity t at this moment, supporting the likelihood of a bearish rally. Despite the current upward trend leading to a bullish trend, the bears regained power by pushing the price low.
The bears showed strength by breaking through the lower trend, lowering prices even lower. The bears seem to mind at the $-.0004 target price. However, if the bulls regain strength and push the price high, they will reach a target price of $0.004964, which will benefit the buyers.
Advertisement


Charles Kibue
Charles Kibue is a cryptocurrency researcher and writer with published works on Crypto2Community and a range of other sites. He has also worked as a technical writer, researching NFTs and crypto projects. Charles is an English Literature graduate residing in Kenya. He possesses additional expertise in market analysis and offers accurate and reliable insights, staying up-to-date with the latest developments in the crypto industry. Beyond his professional pursuits, Charles enjoys hiking and horse riding in his leisure time.
View full profile ›ℹ️About Crypto2Community's Editorial Process
Crypto2Community's editorial policy is centered on delivering thoroughly researched, accurate, and unbiased content. We uphold strict editorial policy and sourcing standards, and each page undergoes diligent review by our team of top crypto industry experts and seasoned editors. This process ensures the integrity, relevance, and value of our content for our readers.