io.net Price Prediction: IO plummets 18% As The Airdrop’s Initial Phase Ends Soon

Cryptocurrency trading is speculative and your capital is at risk when you trade. We may earn affiliate commissions from some of the products on this page - at no extra cost to you.

The io.net price has plunged 18% in the past 24 hours to trade at $4.49 as of 8:11 am EST, on trading volume that plummeted 15% to $452 million. This comes as the project team notifies its users of the final stages of its airdrop.
Further, the Ignition Season 1 and Season 2 period will end on 6/18/24 at 11:00 UTC. Users with eligible wallets must claim before the claim window closes. If one misses the two seasons, the Season 3 claim period will open next month at 13:00 UTC.
Advertisement

The claim period for Ignition Season 1 and Season 2 will end on 6/18/24 at 11:00 UTC.
Users with eligible wallets must claim prior to the claim window closing. The claim period for Season 3 will open on 7/1/24 at 13:00 UTC.
— io.net (@ionet) June 17, 2024
This comes amid a strong bearish sentiment in the IO market. However, some investors are optimistic about the project, believing that it is one of the most promising tokens.
IO advertises as a cost-effective and reliable decentralized GPU computing platform. It offers a decentralized computing network, providing affordable access to high-end GPUs for mid-sized companies and startups.
io.net(IO) Statistical Data
- io.net price now – $4.50
- io.net market cap – $430.5 million
- io.net total supply – 800 million
- io.net circulating supply – 95 million
- io.net ranking – #138
The newly launched Solana-based DePIN platform project dropped significantly after debuting on major cryptocurrency exchanges.
The io.net price is trading with a bearish bias on the two-hour timeframe. It remains within the confines of a descending triangle pattern, which is a bearish technical formation.
io.net’s price has been on a downtrend since hitting its all-time high of $6.5052. However, the bulls have found support around $4.6821, pushing the price to the resistance zone at $5.8256.
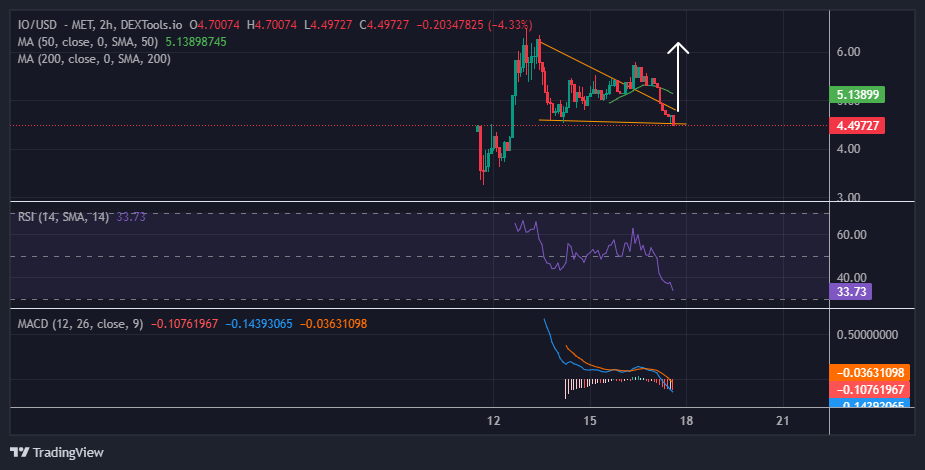
The technical indicators support the bearish outlook, as the io.net price trades below the 50-day SMA(Simple Moving Averages). This signals the intense selling pressure in the IO market.
Moreover, the Relative Strength Index (RSI) trades down from the 50-midline level, currently at 33, as it hurtles towards the 30-oversold level. This solidifies the downward trend, tilting the odds in favour of the bears.
The MACD( Moving Averages Convergence Divergence) also points to the negative territory. The red histograms support the bearish thesis, signalling that the sellers have the upper hand. Notably, the recent crossover of the blue average line below the orange signal line downwards further supports the bearish sentiment.
Will The Bulls Recover Their All-time High?
Despite a recent decline, io.net’s price might bounce back and trade above the 50-day SMA, potentially kickstarting a strong bullish rally. The bulls might also utilize the dip and set a buyback campaign that may lead to a bullish IO market price reversal.
In a highly bullish scenario, the bulls might drive the price upward, surpassing the technical barrier at around $5.82, potentially aiming for the ATH.
Conversely, if bearish sentiment persists and pushes the price lower, it may drop to around $3.56.
Bottom Line
As io.net navigates the volatility typical of new market entrants, the coming days will determine whether this price dip is a short-term correction or the beginning of a larger trend.
Investors and traders will closely watch market signals and trading volumes to gauge the platform’s future performance.
The IO token can be traded on centralized exchanges like Binance. The most active trading pair, IO/USDT, has a trading volume of $179.8 million.
Learn More
- Waka Flocka Flame Faces Backlash Over Launch of Solana Meme Coin
- 20 Top Cryptocurrencies to Watch for 2024 – Detailed Reviews
- Next Cryptocurrency to Explode in 2024
Disclaimer: Cryptocurrency is a high-risk asset class. This article is provided for informational purposes and does not constitute investment advice. You could lose all of your capital.


Advertisement


