Grass Price Surges 6% Amid Volume Drop; Analysts Eye Potential Buying Opportunity

Cryptocurrency trading is speculative and your capital is at risk when you trade. We may earn affiliate commissions from some of the products on this page - at no extra cost to you.

Highlights:
- GRASS rises 6% in 24 hours, now at $1.68. Trading volume fell 17% to $276 million, with a $411 million market cap.
- Despite airdrop issues on October 28th, it peaked at $1.9175 on November 2nd.
- GRASS couldn’t break $2, cooling to $1.45. Analysts expect a deeper pullback, possibly a buying opportunity.
The Grass price surged 6% in the last 24 hours to trade at $1.68 as of 8:25 a.m. EST, despite a 17% drop in trading volume to $276 million. Now, the market capitalization stands at $411 million.
Advertisement

The GRASS token has been generating serious buzz as one of the newest projects in the DePIN space. Built on the Solana blockchain as a Layer-2 platform, Grass lets users share their unused internet bandwidth via a browser extension to train AI models.
👀 New blog post! A Gentle Introduction to DePIN – Decentralised Physical Infrastructure Networks.
In this post I describe DePIN projects as a new capital-light crowdsourcing business model, where contributors participate in the success of the project.https://t.co/M9Q5hZDO4t
— Antony Lewis (@antony_btc) October 30, 2024
Despite a few hiccups during its highly anticipated airdrop on October 28th, most notably a three-hour outage, the token managed a successful rally. On October 29th, it peaked and then saw a strong upward run from October 31st to November 2nd, breaking through the $1.50 mark.
After reaching a high of $1.9175 on November 2nd, GRASS has since cooled off, now settling below $1. 68 and currently trading around $1.45. The token has struggled to break the $2 level, and analysts predict a potential for a deeper pullback. This raises the question: is now the right time to buy?
GRASS Statistics
- Grass Price: $1.68
- Market capitalization:$411 million
- Trading Volume: $276 million
- Circulating supply: 243 million
- Total supply: 1 billion
Grass Price Signals a Breakout Above the Bullish Wedge
This GRASS/USD chart shows a consolidation phase within a bullish wedge pattern, where converging trendlines, a resistance trendline above, and a support trendline below create a narrowing range. This pattern often hints at potential bullish momentum, as it tends to resolve with a breakout to the upside. Currently, the price is at $1.64082, near the upper resistance of the wedge, indicating that a breakout could be imminent if buying pressure continues.
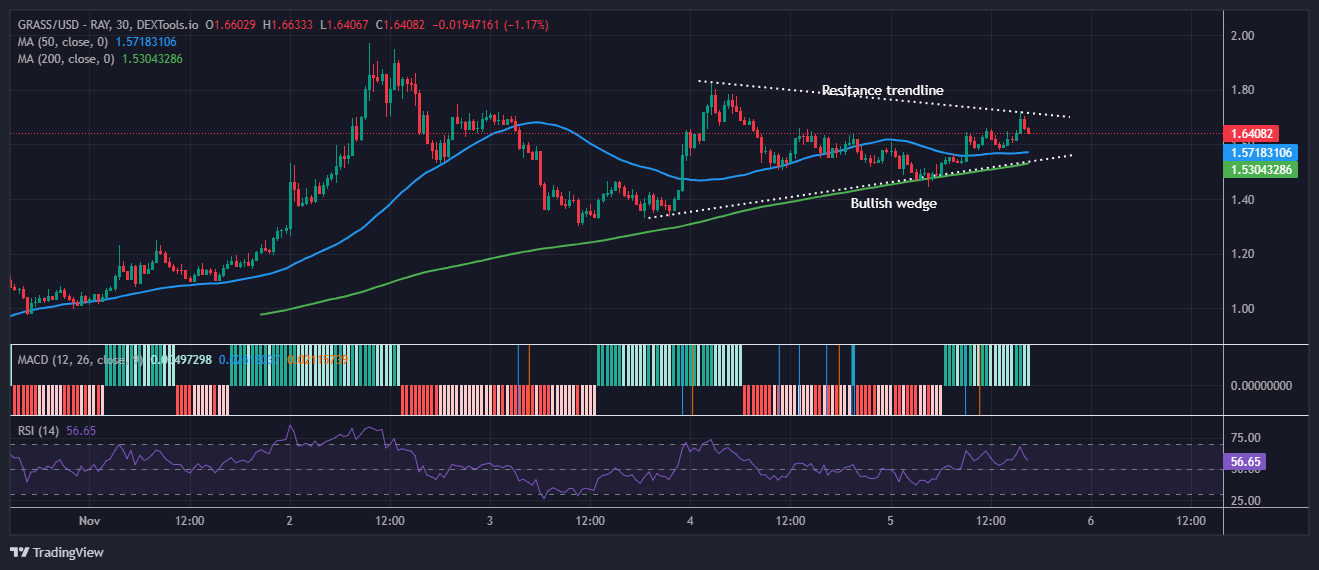
The simple moving averages (SMAs) reinforce this bullish bias. The 50-period MA (blue line) is above the 200-period MA (green line), with the 50-period around 1.57 and the 200-period at about 1.53. This “golden cross” alignment generally supports upward trends if the price remains above both MAs.
The MACD indicator, while showing some mixed signals, has a slightly positive reading, suggesting moderate upward momentum that could strengthen with a breakout above the resistance trendline.
Bullish Technicals Signal a Bullish Rally
The moving averages (MAs) reinforce this bullish bias. The 50-period MA (blue line) is above the 200-period MA (green line), with the 50-period around 1.57 and the 200-period at about 1.53. This “golden cross” alignment generally supports upward trends if the price remains above both MAs. The MACD indicator, while showing some mixed signals, has a slightly positive reading, suggesting moderate upward momentum that could strengthen with a breakout above the resistance trendline.
The Relative Strength Index (RSI) is currently at 56.65, which leans bullish but isn’t near overbought territory (70). This level suggests there is still room for further Grass price gains before an overbought pullback might occur, supporting the possibility of an upcoming breakout.
If the price breaks above the wedge resistance, it could target levels around 1.80 and higher. On the downside, should the price fail to break out and decline, it would likely find support at the wedge’s lower trendline. The 50-period MA at 1.57 and the 200-period MA at 1.53 would also act as significant support levels in the case of a downward move.
Advertisement


