Grass Price Surges 12% as Symmetrical Triangle Signals Potential 150% Rally

Cryptocurrency trading is speculative and your capital is at risk when you trade. We may earn affiliate commissions from some of the products on this page - at no extra cost to you.

Highlights:
- The price of Grass has rallied 12% to $2.27 in the past 24 hours.
- A crypto analyst has highlighted a potential 150% rally in the Grass market.
- CoinGlass data indicates rowing market confidence, which may push the GRASS token to $3.
Currently, the Grass price is up 12% in the past 24 hours to trade at $2.27. Bolstering the bullish picture is its daily trading volume, which has spiked 44% to $81M. This shows intense market activity, with traders optimistic of a further price surge. Grass price is showing signs of a bullish breakout after confirming a symmetrical triangle. Market analysis and indicators show a surge might be on the horizon. Traders are hoping for a rally of over 150% in the days to come.
Advertisement

$GRASS Massive Symmetrical Triangle Breakout is finally confirmed..✅
Expecting +150% Bullish Rally in the Coming Days.. 📈#Crypto #GRASS #GRASSUSDT pic.twitter.com/rqyOR6Z7hB
— Captain Faibik 🐺 (@CryptoFaibik) May 21, 2025
Grass Price Outlook
A symmetrical triangle shows up in the daily chart of GRASS/USD, hinting at a forthcoming period of consolidation before there’s a breakout. The pattern appears when price movement falls between two trend lines which feels a period of low volatility and can indicate an upcoming sharp move.
Grass price is approaching the upper boundary of the triangle near $2.27 and could break out shortly. Important technical indicators are suggesting that the market has already started to rise. RSI for the asset is at 68.63 which means it’s being bought strongly but isn’t considered overbought yet. The MACD indicator is supporting the idea of upward movement as its MACD line crossed above the signal line.
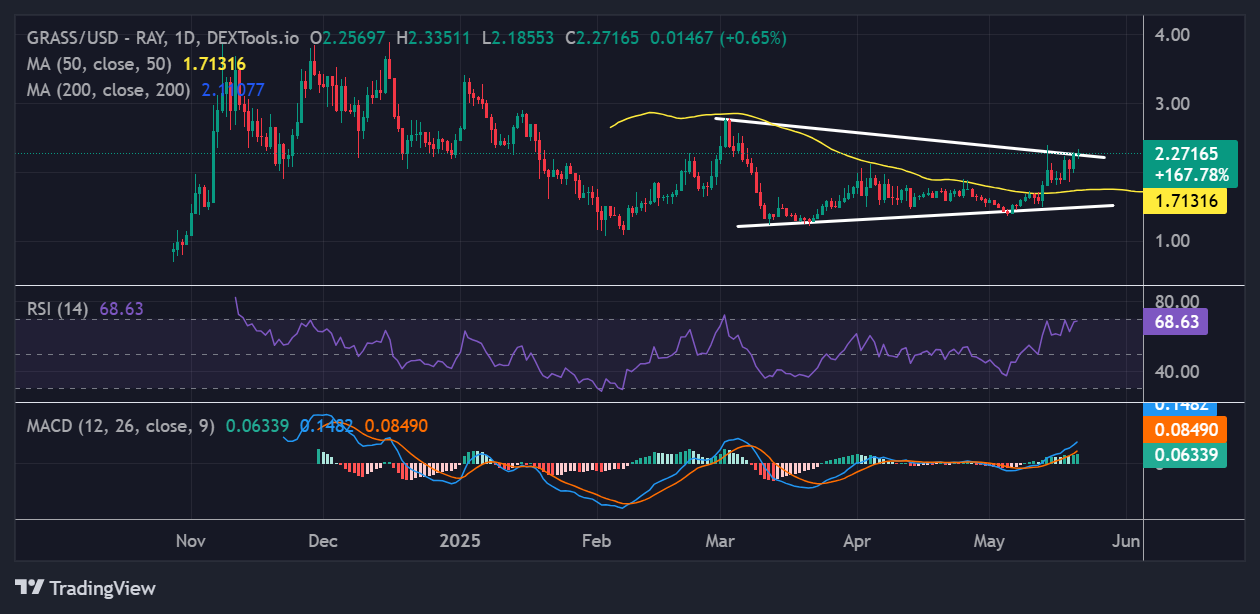
Moving averages also give us Grass Bulls extra support. Currently, the 50-day moving average is close to $1.71, giving the bulls strong support for further upside. The breakout could give the Grass price extra support, especially at these averages.
Derivatives Data Reflect Growing Market Confidence
The GRASS derivatives market is lively and looks promising. Trader interest and liquidity are at their highest ever, as shown by the 55% rise in trading volume to $175 million. More than 10% more open interest has been added, bringing the total to almost $130 million. Because traders are not only getting into new positions but also keeping them, it hints that investors bet on Grass price to spike.

Good trends are being seen in exchange long-to-short ratios that favor the bulls. Binance’s GRASS/USDT market has a long-to-short ratio of more than 1.25, while on OKX, this ratio is approximately 1.35. More people anticipate that the price will increase rather than decrease, as these figures reflect. Moreover, the overall long-to-short ratio sits at 1.02, indicating a bullish grip.
What’s Next for GRASS?
GRASS is set for a big rise in price because the technical and derivatives charts have aligned. If the Grass price holds above key support, the first goal sits at $2.75 for short-term entries. Increased bullish momentum could propel the token towards $3 and $3.34 Even so, traders need to stay cautious. If the price loses its momentum, investors may see the asset retest support at $2.05 or $1.88 support levels.
It is important for investors to consistently watch these three indicators. A surge in trading volumes and sturdy bullish trends are probably going to help the rally. Oppositely, if the trend appears to be slowing down, careful thinking and possible adjustments may be advised.
![]()
eToro Platform
Best Crypto Exchange
- Over 90 top cryptos to trade
- Regulated by top-tier entities
- User-friendly trading app
- 30+ million users
![]()
eToro is a multi-asset investment platform. The value of your investments may go up or down. Your capital is at risk. Don’t invest unless you’re prepared to lose all the money you invest. This is a high-risk investment, and you should not expect to be protected if something goes wrong.
Advertisement


