Gorilla Price Prediction Surges 17% and Could Be the Next To Explode

Cryptocurrency trading is speculative and your capital is at risk when you trade. We may earn affiliate commissions from some of the products on this page - at no extra cost to you.

The Gorilla price has slumped by 17% in the last 24 hours to trade at $0.0004138 as of 9:45 a.m. EST, despite a 919% surge in trading volume to $4.06 million.
With this surge, GORILLA has outperformed its peers. A decisive candlestick close above the current resistance level would confirm the continuation of the uptrend, signalling that GORILLA is a strong buy.
Advertisement

Gorilla is a meme coin within the DeFi ecosystem. It offers an IDO launchpad, a cross-chain token swap tool, and a peer-to-peer trading dApp.
#GORILLA 4H TIMEFRAME UPDATE
Gorilla is a meme coin-cross DeFi ecosystem, offering an IDO launchpad, a cross-chain token swap tool, and a peer-to-peer trading dApp
ANY THOUGHTS ON $GORILLA?
❤️ THIS POST AND I WILL SHARE NEXT 10X GEM COIN pic.twitter.com/K2XyhckQPy
— FortuneNodeOfficial (@Fortunenode_) July 3, 2024
Gorilla Price Statistics
- Gorilla Price: $0.0004138
- Market cap: $3.3 million
- Trading volume: $4.06 million
- Circulating supply: 771.23 million
- Total supply: 898.44 million
Gorilla Price Bulls Strive and Manage to Get out of the Bearish Channel
The market has faced considerable pressure, with bears nearly driving the price down to a support level of $0.00331. However, once the price reached this support zone, the bulls regained control, pushing the price upward, to the upper trendline of the bearish channel. This movement indicates a potential bullish reversal, suggesting that the market may be shifting from a bearish to a bullish trend.
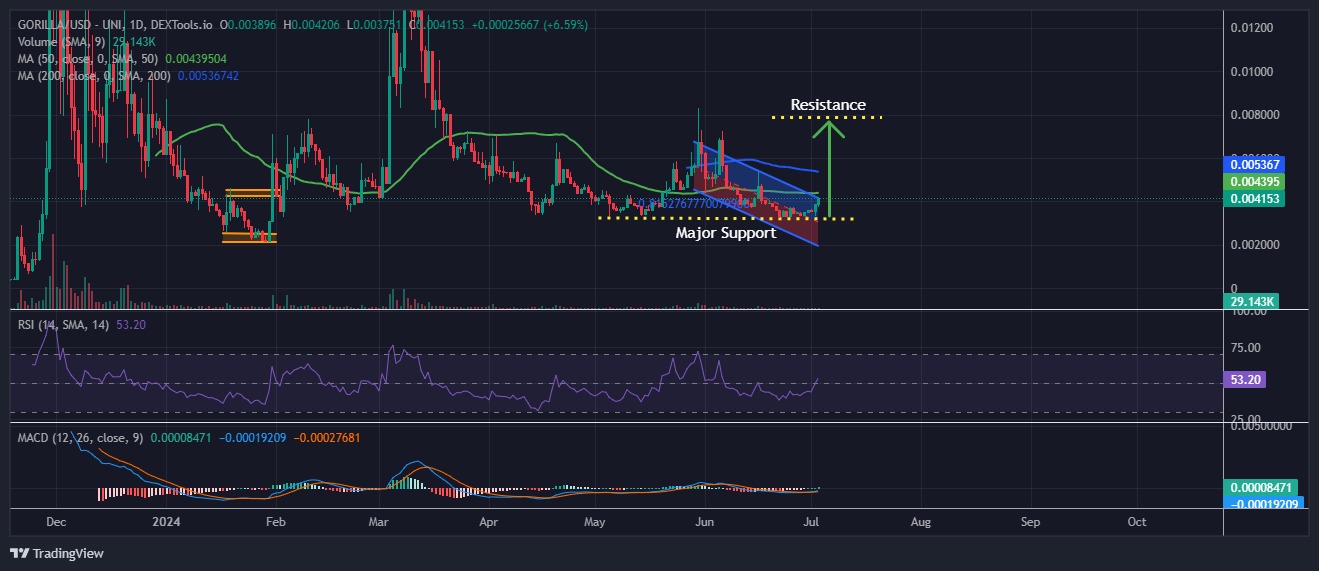
GORILLAUSD Analysis (Dextools.io)
The GORILLAUSD chart shows strong signs of a bullish breakout on the daily chart, with the price reaching the 50-day simple moving average (SMA), which now acts as resistance. If this bullish momentum continues, it could help the bulls push the price above the 50-day SMA. A further push above the 200 SMA may confirm the overall bullish sentiment for the Gorilla price.
Gorilla Price May Surge on Bullish Technicals
The Relative Strength Index (RSI) also reinforces the market’s bullish sentiment. It has surged past the 50-midline, which is a critical level indicating the transition from bearish to bullish conditions. Currently, the RSI is moving towards the 70-overbought level, suggesting increasing buying pressure.
If the RSI surpasses the 70-overbought mark, it typically signifies that the asset is experiencing strong bullish momentum. This could trigger further buying activity and increase the price, potentially leading to a significant upward trend. In such a scenario, the market would heavily favor buyers, as the continued rise in RSI reflects growing confidence and demand among investors.
The Moving Average Convergence Divergence (MACD) indicator also confirms the bullish outlook. The blue MACD line has crossed above the orange signal line, a positive signal suggesting the potential for continued upward momentum.
Moreover, the green histogram bars are rising and increasing in size, indicating growing bullish strength. This reinforces the likelihood of an impending bull rally and a significant bullish crossover, further supporting the optimistic sentiment in the market.
Gorilla Price Prediction: Bulls Gear Up for a Bully Rally
The bulls are poised to recover their losses in Gorilla’s price, as they are teasing to surpass the upper line of the bearish channel. If the price continues to climb and surpasses the 50 and 200 SMAs, the bulls could drive it up to $0.007934.
However, if Gorilla encounters resistance at the upper trendline, its price could decline, potentially falling below the $0.003191 support level. This would invalidate the bullish outlook and suggest a possible downward trend.
Read More
- Next Cryptocurrency to Explode in July 2024
- Crypto Price Predictions
- BinaryX Price Explodes 18% As It Emerges Among The Top Gainers, Will The Bulls Sustain The Momentum?
- Best Crypto Exchanges in 2024


Advertisement


