Ethereum Price Soars 2% as Bulls Show Strength, How High Can ETH Reach This September?


The Ethereum price is at a standstill, trading around $2,511 and meeting resistance at $2,605, within a sustained bearish flag. Despite several attempts, the price has struggled to break above this critical level, signaling a continued bearish sentiment. Traders are closely watching this key resistance, as a failure to overcome it could lead to further declines toward $2,260. On the other side of the fence, if the bulls overcome this critical zone, the ETH price could reclaim the 3,000 mark.
Its 24-hour trading volume has gone ballistic, surging 75% to $14.02 billion, signaling a rise in market activity. Meanwhile, there have been at least $43.82 million liquidations of ETH in the last 24 hours based on data from Coinglass. The lion’s share of them, approximately $32.14 million, were accounted for by longs, with shorts taking up the rest, at least $11 million.
Advertisement

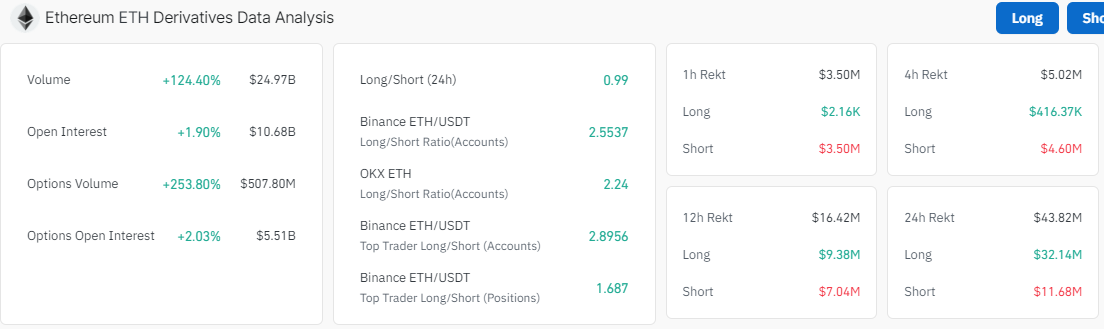
Notably, the Open interest (OI) has surged over 1% to $10.68 billion, with the volume increasing 124% to $24 billion. This suggests investor confidence in Ethereum, which might lead to a potential shift in sentiment in the ETH price direction.
Ethereum Statistical Data
Based on CoinmarketCap data:
- ETH price now – $2,462
- ETH market cap – $296 billion
- ETH total supply – 120 million
- ETH circulating supply – 120 million
- ETH ranking – #2
Will September Provide Recovery Opportunities in the ETH Market?
The cryptocurrency market recently has been turbulent, with Ethereum (ETH) and Bitcoin (BTC) both experiencing significant declines in August. However, it only remains to see whether September will offer recovery opportunities in the crypto market. Currently, the Ethereum price shows some signs of recovery, as it is hurtling towards the $2,600 resistance. However, with some bearish prospects in the market cemented by the bearish flag, will the bulls gain momentum?
As of today, ETH is trading at $2,511.26, with the bulls aiming to break above the $2,885 resistance zone. The ETH price trades below the 50-day and 200-day Simple Moving Averages (SMAs)reinforcing dwindling buyer momentum in the market. In this case, the bulls must conquer the $2,885 and $3,253 resistance zones to resume an upward rally.
However, the Relative Strength Index (RSI) has hurtled from the 30-oversold zone, currently at $41. This shows potential signs of a rebound if the buyers keep adding to their positions. Increased buying pressure will cause the RSI to jump above the 50-mean level, validating a bullish thesis.
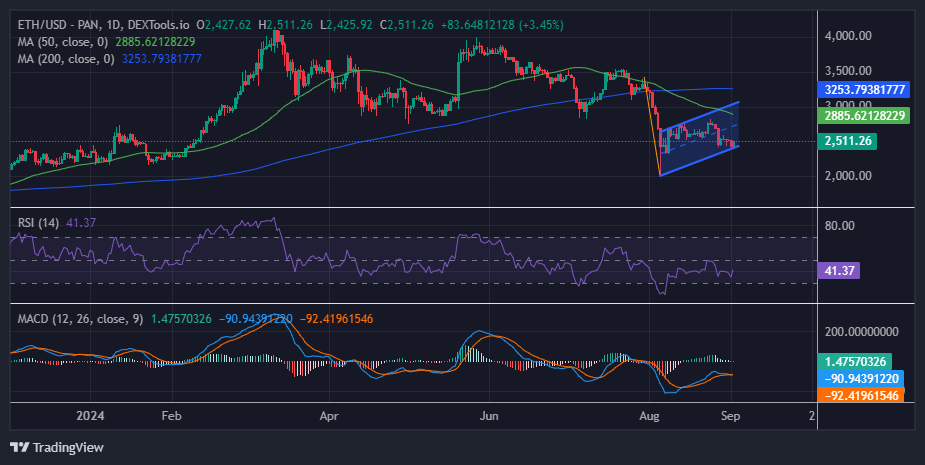
Furthermore, the Moving Average Convergence Divergence (MACD) upholds a bullish outlook. This is manifested as the MACD indicator (blue) has crossed above the signal line (orange), affirming the buy signal. As the momentum indicator gradually ascends above the mean line (0.00) into the positive region, the path with the least resistance stays on the upside. Moreover, traders are inclined to buy ETH unless the MACD changes.
Ethereum Price Outlook
In the daily chart above, the bulls are showing some strength, aiming to reclaim the 3,000 mark. If the bulls capitalize on the MACD, which calls for traders to rally behind ETH, the price of Ethereum could surge. The break and close above the $2,605 resistance level could reignite bullish momentum, with the next target set at $2,885.
Conversely, with the bearish flag still in the market, the ETH price could drop. Moreover, the ETH price trades below the 50-day and 200-day SMAs, reinforcing the bearish sentiment. If Ethereum fails to hold above the $2,418 support, the next key level to watch is $2,318. A further drop could push the price toward $2,260.
Advertisement


Emmaculate Araka
Emmaculate Araka is a cryptocurrency writer with published works on Crypto2Community and other news sources. She is believer in the transformative power of crypto and the blockchain industry, conducting on-chain analysis, breaking down market-triggering events, and helping traders and investors benefit from expert technical price analysis. Emmaculate finds gratification in diving deep into the crypto space, earning herself significant knowledge and experience. She holds a Bsc. in Information Science, and outside work, Emmaculate loves reading novels and watching documentaries.
View full profile ›ℹ️About Crypto2Community's Editorial Process
Crypto2Community's editorial policy is centered on delivering thoroughly researched, accurate, and unbiased content. We uphold strict editorial policy and sourcing standards, and each page undergoes diligent review by our team of top crypto industry experts and seasoned editors. This process ensures the integrity, relevance, and value of our content for our readers.