


The Ethereum price plunges 8% in the last 24 hours to trade at $3171 as of 03:29 a.m. EST on a 5% drop in trading volume to $20 billion. This price drop happened as U.S.-based Ethereum ETFs saw $113.3 million in net outflows on their second trading day, mainly due to large withdrawals from Grayscale’s recently converted Ethereum Trust.
#Ethereum ETFs witnessed $113 million in net outflows on their second day of trading, with Grayscale ETHE bleeding to blame. pic.twitter.com/FhszKAc6ga
Advertisement
— Cointelegraph (@Cointelegraph) July 25, 2024

Despite this, seven of eight new spot Ether ETFs had net inflows on their second trading day. The Fidelity Ethereum Fund (FETH) led with $74.5 million, followed by the Bitwise Ethereum ETF (BITW) with $29.6 million. BlackRock’s iShares Ethereum Trust (ETHA), which had the most inflows on July 23, received $17.4 million on July 24.
Ether ETFs experienced net outflows on their second trading day, mainly due to significant selling from the converted Grayscale Ethereum Trust (ETHE). ETHE, initially launched in 2017 by Grayscale to allow institutional investors to buy ETH with a six-month lock-up period, saw $326.9 million in outflows.
U.S. spot Ether ETFs saw $113.3M outflows on day 2, driven by Grayscale's #Ethereum Trust shedding $326.9M
Despite this, Fidelity and Bitwise ETFs posted $74.5M and $29.6M inflows 📉 $ETH down 7% in 24h, now at $3,175 pic.twitter.com/XpDkVFDIod
— Tony (@cryptoniooo) July 25, 2024
After converting to a spot Ether fund on July 22, investors could sell their ETH more easily. In the two days following the conversion, ETHE had $811 million in outflows, over 9% of its holdings.
Ethereum Price Statistics
- Ethereum price:$3171
- Market cap:$318 billion
- Trading volume:$20 billion
- Circulating supply:120 million
- Total supply:120 million
Ethereum Price Bulls Face a Resistance on the Upper Trendline of the Bearish Channel Pattern
The Ethereum price declined after the bulls hit a resistance level at the upper trendline of the bearish channel. This has allowed the bears to push the price almost to the lower boundary of the channel at $2,959.
This drop has pushed the price slightly below the 50-day Simple Moving Average (SMA). But can the bulls remain resilient?
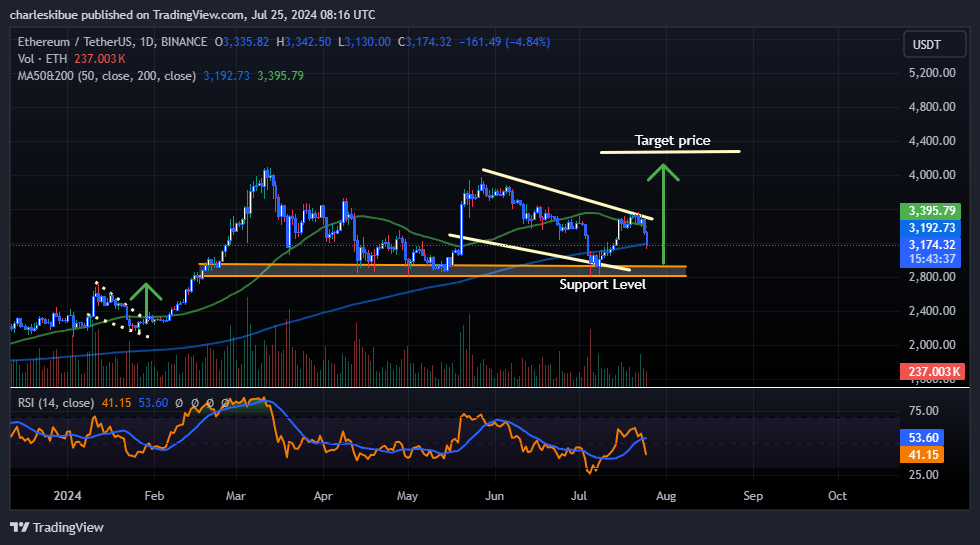
The bulls are still getting strong support from the 200-day SMA, even though it’s trading within a bearish channel and acting as a major support area. This support may help to boost the overall positive outlook for Ethereum’s price. The Relative Strength Index (RSI) rebounded from 67 and dropped to the 50 midline level, indicating intense buying pressure. A bullish trend continuation could see the RSI enter the overbought threshold of 70.
Moreover, the MACD average line has crossed below the signal line, falling below the neutral level, which may indicate a potential bearish trend. The histogram bars are also turning red, dictating intense selling pressure.
Ethereum Price Prediction
Bullish traders still have an opportunity to push the price up to aiming to break out of the bearish channel pattern and hit a target price of $4221. The support from the double bottom parten is still valid and may help the bulls rebound on the 200 SMA to reclaim the all-time high at $4878.
However, bearish traders might continue the downtrend to the channel’s lower trendline and push the Ethereum price to around $2955 below the 200-day SMA. This support zone is important because it has previously prevented further declines and could act as a strong barrier against a bigger price drop.
Advertisement


