


Despite the recent debut of the spot Ethereum ETFs in the United States, the ETH price is down 1%, with the ETH/USD trading at $3,462 at press time. Its 24-hour trading volume has notably plummeted 5% to $20 billion, suggesting dwindling market activity among traders and investors.
However, the launch of Ethereum ETFs has displayed a promising start, recording a net inflow of $107 million on their first day of trading.
Advertisement

UPDATE: First full day of flows for the ETHness stakes are in. The Ethereum ETFs took in $107 million. @BlackRock's $ETHA lead the way with $266.5 million followed by @BitwiseInvest's $ETHW with $204 million. Very solid first day pic.twitter.com/j28vIwVWvR
— James Seyffart (@JSeyff) July 24, 2024
Despite a significant outflow from Grayscale’s Ethereum Trust, BlackRock’s iShares Ethereum Trust ETF (ETFA) led the pack with an inflow of $266.5 million. Bitwise Ethereum ETF (ETHW) followed with $206 million, as Fidelity Ethereum Fund ETF (FETH) secured the third position with inflows of $71.3 million.
Meanwhile, according to Santiment, the release of Ethereum’s nine new spot ETFs impacts whale activity. Since July 17, ETH transfers exceeding $100K in value have been over 64% higher than BTC transfers and +126% higher than USDT (on ETH) transfers.
🐳 Whale activity is clearly being impacted by the release of Ethereum's 9 new spot ETF's. Since July 17th, the amount of ETH transfers exceeding $100K in value is +64% higher than the amount of BTC transfers, and +126% than the amount of USDT (on ETH) transfers. 🤯 pic.twitter.com/SnLem6ko5G
— Santiment (@santimentfeed) July 23, 2024
Ethereum Statistical Data
Based on Coinmarketcap data:
- ETH price now – $3,462
- ETH market cap – $416 billion
- ETH total supply – 120 million
- ETH circulating supply – 120 million
- ETH ranking – #2
Ethereum Price Consolidates Within a Flag Pattern
After hitting the resistance zone at $3,556, the ETH price consolidated, forming a bullish flag pattern. The bulls aim to capitalize on the flag to stage a breakout that could trigger a rally. Often, traders and investors interpret the flag pattern as a continuation of an uptrend.
The bulls have established strong support at the $3,374 mark. However, they face immediate resistance at $3,479, which coincides with the 50-day SMA (Simple Moving Average). A break out above the 50-day SMA could trigger a rally in the ETH market, which could see the Ethereum price record a new ATH. Moreover, the altcoin trades well above the 200-day SMA, offering strong support at $3,315.
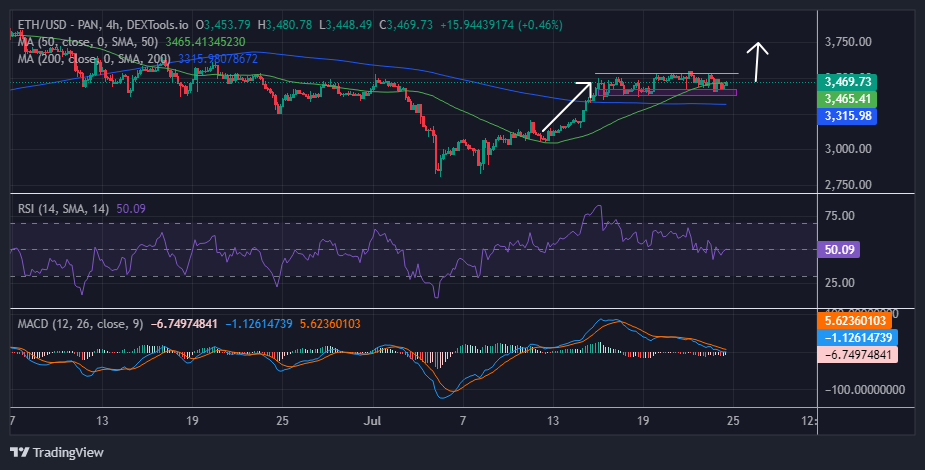
Meanwhile, the Relative Strength Index (RSI) has hurtled from the 30-oversold zone, currently sitting at 50. This suggests that the ETH market is at equilibrium, with both the bulls and bears struggling to gain control. However, with the bulls showing resilience, the RSI could hurtle towards the north, targeting the overbought zone.
On the other hand, the MACD indicator has crossed below the signal line (orange), shifting the momentum from bullish to bearish. Unless the MACD changes, the traders will sell the ETH, suggesting dwindling buyer momentum.
Will the Bulls Capitalize on the Golden Cross at $3,325?
Based on the 4-hour chart analysis in the ETH market, the bulls could push the price upward if they capitalize on the golden cross made by the two moving averages (50-day and 200-day SMA) at $3,325. This stance supports the bullish picture in the market, which could lead to the bulls surpassing the immediate resistance at $$3,479. In a highly bullish scenario, the buyers might flip the 50-day SMA into support, targeting the $3,752 mark in the coming days.
Conversely, if the sellers continue selling, the ETH price may breach the $3,374 mark support, invalidating the bullish outlook. This could see the ETH price retrace to the $3,315 support level, coinciding with the 200-day SMA.
Bottom Line
The positive start of the Ethereum ETFs in the crypto sphere suggests growing investor interest. This could pave the way for further expansion in the crypto ETF market, including the recently filed Solana ETFs.
Advertisement


