Ethereum Price Holds Steady as SEC Pauses Ether Security Case

Cryptocurrency trading is speculative and your capital is at risk when you trade. We may earn affiliate commissions from some of the products on this page - at no extra cost to you.

Ethereum is holding its price well and looks ready for a big surge. In the last 24 hours, the Ethereum price has surged 1% to trade at $3,523, while trading volume dropped 9% to $15.6 billion.
This slight surge follows news that the SEC has paused its investigation into whether Ether is a security.
Advertisement

The SEC closes #Ethereum 2.0 case and drops all charges ! pic.twitter.com/HFgistGu6g
— cryptoholix (@crypptoholix) June 19, 2024
Consensys lawyer Laura Brookover stated that the SEC will no longer argue that Ether is a security. According to Brookover, the SEC didn’t voluntarily drop the investigation. Instead, she said it was in response to pressure to “lift the subpoenas on Consensys,” following the recent approval of ETH exchange-traded fund rule changes based on ETH being classified as a commodity.
Ethereum Price Statistics
- Ethereum Price:
- Market Cap:$430 billion
- Trading Volume: $15.7billion
- Circulating Supply: 122 million
- Total Supply: 122 million
Ethereum Price Hints at a Breakout Above the Wedge
The Ethereum price recently attempted a rally but lacked sufficient bullish momentum to maintain its upward trajectory. It failed to stay above the $3,700 resistance level and started declining.
The drop extended past the $3,600 mark, eventually falling below the $3,550 support level. A low of around $3,430 was reached, and now, similar to Bitcoin, Ethereum is indicating a breakout for a rally that could surpass a high price of $4100.
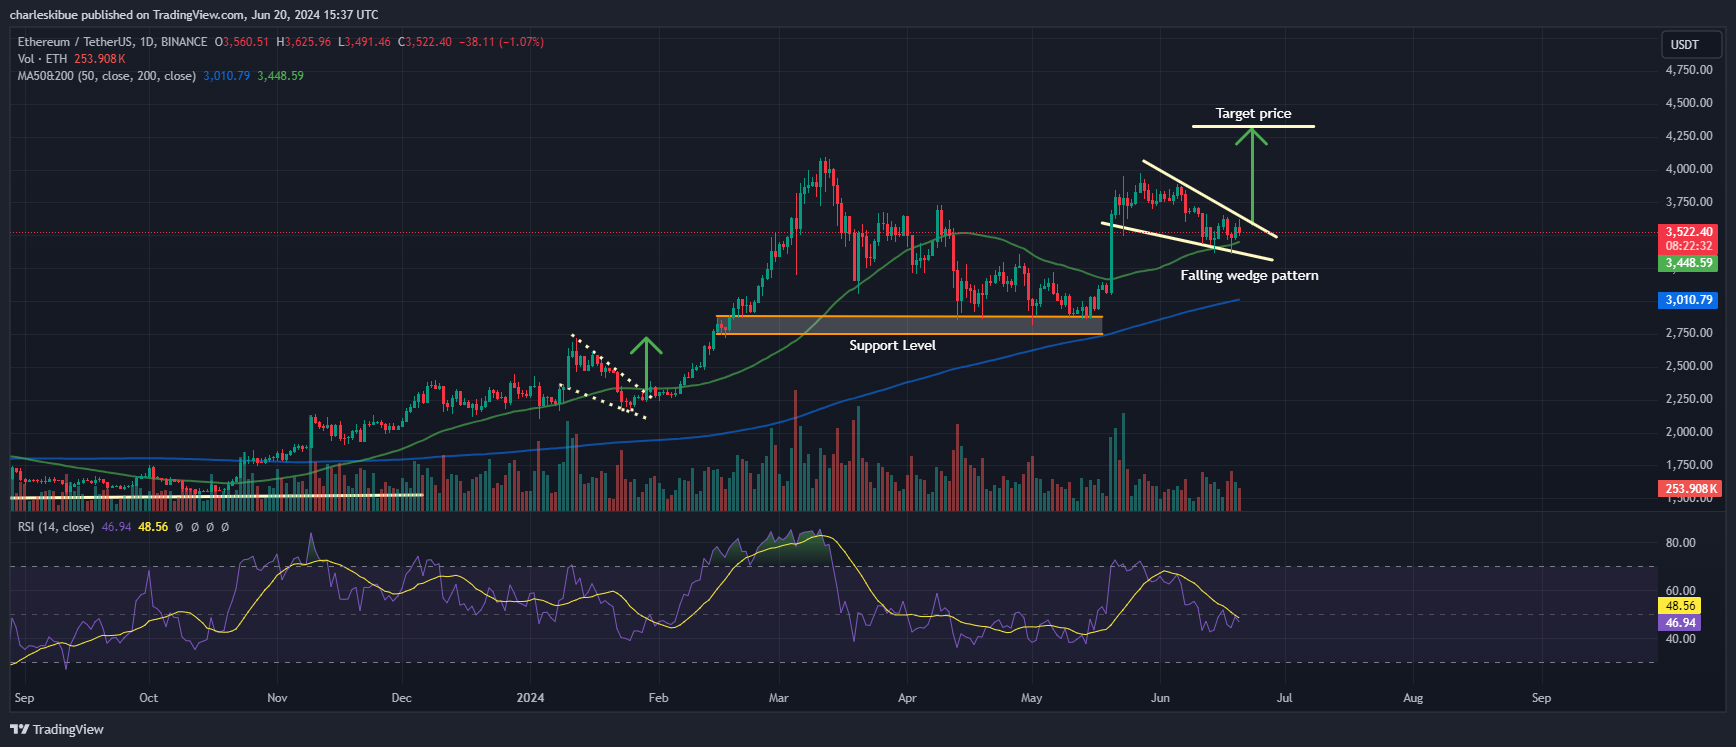
ETHUSDT Analysis (Source: Tradingview)
The formation of a falling wedge pattern suggests the potential for a bullish reversal in prices, potentially prompting bullish investors to push prices higher.
Currently, the price is trading above both the 50-day and 200-day simple moving averages (SMAs), with bulls aiming to break out above the falling wedge pattern to kickstart a rally.
The Relative Strength Index (RSI) is showing signs of recovery, hovering around the 45 mark just below the midline of 50, indicating significant selling pressure on ETH’s price. If bullish momentum increases, it could push the RSI into the overbought territory, confirming the anticipated bullish rally.
Meanwhile, the Moving Average Convergence Divergence (MACD) indicator is currently bullish. The blue average line has crossed above the orange signal line towards the neutral level, suggesting a shift in momentum towards bearish conditions. Moreover, the histogram bars show positive momentum in price movement, which reinforces the bullish outlook.
Ethereum Price Prediction
Ethereum price dynamics show a critical juncture with bulls defending the upward momentum, aiming to regain momentum towards the $4100 mark. However, the presence of falling wedge pattern offers support for the bullish sentiment as bulls seek to drive the price to $4880 all time high.
Should the bears explore the weakness at the upper boundary of the wedge they could pave the way for a downside towards the $3450 support level, corresponding to the wedge’s lower trendline. Traders and investors should monitor these levels closely for potential shifts in market sentiment and price action.
Final Thought
The market is at a critical juncture. While the bulls are showing resilience at the support trendline, suggesting a potential rally to higher levels, the bearish indicators and patterns suggest caution.
If the support fails, further drop levels are likely to occur. Traders should closely monitor these support and resistance levels and the key indicators for clearer directional cues.
Learn More
- GEGE Price Prediction as GEGE Explodes 305% on MEXC Exchange Listings
- 20 Top Cryptocurrencies to Watch for 2024 – Detailed Reviews
- DePIN Crypto Projects to Watch In 2024 – Top 10 DePIN Coins to Buy
- Next Cryptocurrency to Explode in 2024
Disclaimer: Cryptocurrency is a high-risk asset class. This article is provided for informational purposes and does not constitute investment advice. You could lose all of your capital.


Advertisement


