


The Ethereum price is showing signs of a possible recovery despite ongoing bearish conditions. A prominent crypto analyst recently shared on X that the altcoin’s overall downward move should be seen as corrective, which means there is plenty of scope for upside, maybe even towards the ATH.
#ETH is another text book case of Regular Bullish Divergence signalling a reversal in price action to the upside for $ETH
The overall move downwards should be seen as corrective which means there is plenty of scope for upside – maybe even towards the ATH pic.twitter.com/44rjeEM68MAdvertisement
— Matthew Dixon – CEO Evai (@mdtrade) September 9, 2024

At the time of writing, Ethereum is trading at $2,328, up about 1% over the last 24 hours. The 24-hour trading volume stands at $12.59 billion, a 33% increase, with Ethereum holding the #2 spot.
Despite the recent downtrend, ETH is another textbook case of Regular Bullish Divergence signaling a reversal in price action to the upside according to CEO Evai. However, resistance levels and bearish market sentiment could limit significant gains for Ethereum in the short term. Meanwhile, the altcoin is now down by 7% in a week and 12% in a month, yet it holds on to a 41% gain in the past year.
Ethereum Statistical Data
Based on CoinmarketCap data:
- ETH price now – $2,328
- ETH trading volume – $12.59 billion
- ETH market cap – $278.36 billion
- ETH total supply – 120.32 million
- ETH circulating supply – 120.32 million
- ETH ranking – #2
Ethereum Price Attempts a recovery as Bears Paint the Market Bearish
The Ethereum price is attempting a recovery, as it has kicked off at the $2,328 mark. However, over the weekend, the altcoin failed to clear the $2,470 resistance zone, resulting in a fresh decline below $2,300. Ethereum price hit a low level of $2,165, where the bulls also established strong support, as the price now is attempting a recovery.
Based on the technical outlook, the bears capitalized on the death cross formed in the ETH market, on August 7, dwindling the price on a downward trend. Currently, the bulls are suppressed below the 50-day and 200-day Simple Moving Average(SMAs). This outlook suggests some bearish prospects, as the $2,726 and $3,232 act as immediate resistance keys.
Moreover, the Relative Strength Index (RSI) is below the 50-mean level, currently sitting at 38. With the altcoin undervalued at this level, the bulls might initiate a buy-back campaign, causing the RSI to jump above the mean level.
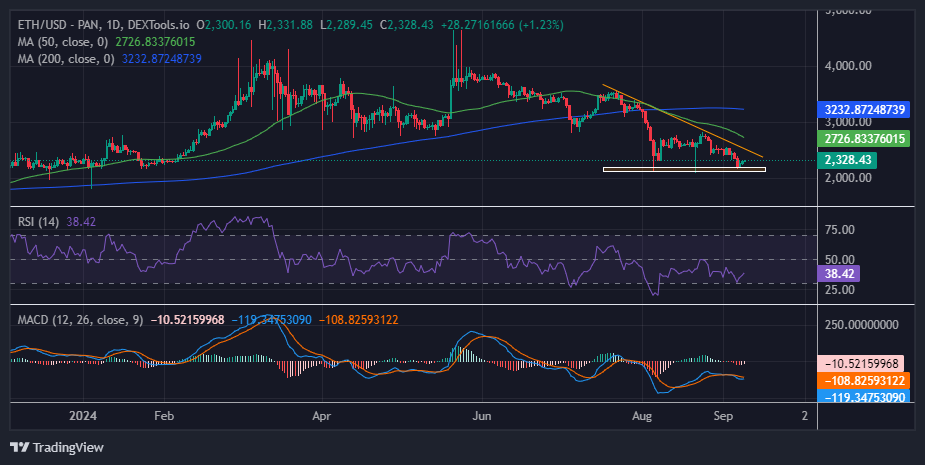
On the other hand, the Moving Average Convergence Divergence (MACD) worsens the outlook, as it upholds a sell signal. This is evident as the MACD indicator (blue) has flipped below the signal line (orange), suggesting a bearish sentiment. Moreover, the MACD indicator is roaming around the negative territory, suggesting intense selling pressure. Meanwhile, as the momentum indicator gradually ascends above the mean line (0.00) into the positive region, the path with the least resistance stays on the upside.
Ethereum Price Outlook
In the daily chart above, the odds tilt in favor of the sellers, painting the big picture bearish. If Ethereum fails to clear the $2,470 resistance, it could start another decline. A clear move below the $2,165 support might push the price toward $2,150. Any more losses might send the price toward the $2,050 support level in the near term.
On the upside, the price seems to be facing hurdles near the $2,470 level. A close above the $2,470 level might send ETH toward the next key resistance at $2,726. A breach and close above the technical barrier will see ETH soar, potentially reclaiming the $3,000 mark.
Advertisement


