


The Ethereum price is staggering in the red zone, having decreased 4%, with the ETH/USD trading at $2,351 at press time. Its 24-hour trading volume has notably plunged 16% to $21 billion, indicating dwindling market activity. ETH is now down 10% in a week, 6% in a month, and a slight increase of 42% in a year.
Despite the ETH price swimming in the red zone, the ETH ETFs have rebounded strongly, recording $14.45M in net profits. Conversely, BTC ETFs have witnessed more outflows to mark losses for the second consecutive day.
Advertisement

🇺🇸 Spot ETF: 🔴$92M to $BTC and 🟢$14.9M to $ETH
🗓️ Oct 02, 2024👉 The net flow for ETH ETFs rebounded strongly, even though the ETH price remains in the red.
👉 4/5 major BTC ETFs experienced outflows yesterday, keeping the overall net flow heavily negative for the second… pic.twitter.com/qt0XUzcXMZ
— Spot On Chain (@spotonchain) October 3, 2024
Meanwhile, Franklin Templeton has proposed launching a new ETF to allow investors to gain exposure to Bitcoin and Ethereum within a single fund. The ETF’s assets will be Bitcoin, Ethereum, cash, and cash equivalents, which are short-term securities with a maturity of less than three months.
Franklin Templeton submitted a proposal for a Bitcoin & Ethereum ETF to the SEC! 🚀 For investors it’s opportunity to gain exposure to $BTC and $ETH in a single fund.
As of today we can see in BTC ETF inflows (-$91.76M) vs ETH ETF inflows (+$14.45M). pic.twitter.com/akp0MX56Tw— kerya.eth 🇺🇦 (@Alex_Kerya) October 3, 2024
Ethereum Statistical Data
Based on CoinmarketCap data:
- ETH price now – $2,351
- Trading volume (24h) – $21 billion
- Market cap – $282 billion
- Total supply – 120 million
- Circulating supply – 120 million
- ETH ranking – #2
Ethereum Price Faces Strong Selling Pressure: Is $2,158 the Next Reach?
The Ethereum price (ETH) has been stuck in an unhealthy correction since early July, when it hit an incredible milestone, posting a record price of $3,500. Its downtrend continues without any signs of stopping, to the extent that it is trading at $2,347, down 33%, a low last seen in January.
The bears have put their best foot forward, quashing the buying pressure in the Ethereum market. This has resulted in the formation of a triangle pattern. However, the ETH price may slip below the lower trendline before a substantial leg up.
Diving into the technical information, the ETH price trades below the 50-day and 200-day Simple Moving Averages. The bears have established a solid technical barrier at $2,510 and 3,100, forcing the bulls to retreat. Meanwhile, if the bears increase their selling appetite at this level, the ETH price could hit the $2,000 mark in the short term.
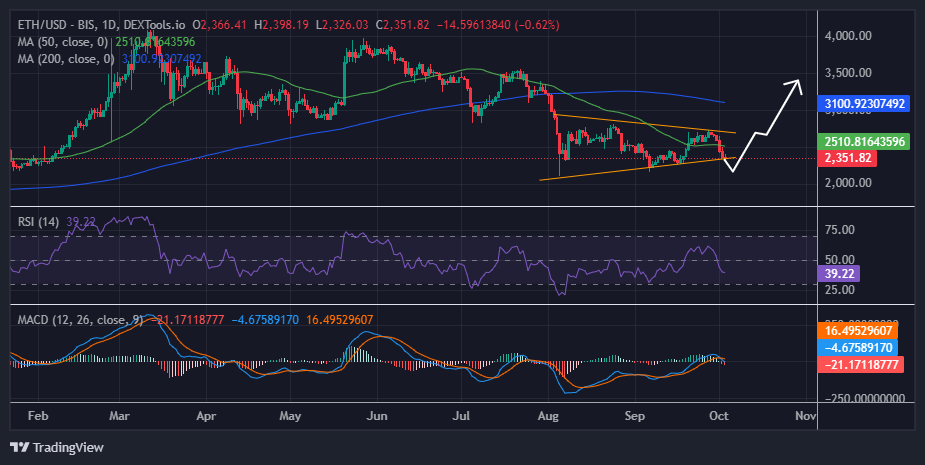
On the other hand, the Relative Strength Index (RSI) has plunged to the oversold region, tilting the odds in favor of the sellers. Currently, the RSI sits at 39.22, signaling increased bearish sentiment. However, if the bulls capitalize on the oversold RSI, they could initiate a buy-back campaign, causing the RSI to jump above the 50-mean level.
Furthermore, the Moving Average Convergence Divergence (MACD) worsens the outlook, upholding a bearish outlook. This is evident as the blue MACD line has jumped below the orange signal, suggesting a selling signal. In the meantime, traders and investors are free to sell the ETH unless the MACD changes. The momentum indicator must move upward to the mean line (0.00) and into the positive region to validate the uptrend.
Ethereum Price Outlook: Will the Bulls Gain Momentum?
The Ethereum price has seen increased selling pressure, forcing the bulls to retreat and search for enough liquidity before resuming a meaningful uptrend. In the meantime, the bears dominate the market as they aim to hit the $2,158 level.
However, if the bulls build momentum and step into the market, they would resume a meaningful upswing which could propel ETH above the $2,510 resistance level. A breach and break above the $2,810 mark in a highly bullish case will see ETH reclaim the $3,000 level.
Advertisement


