Ethereum Price Analysis: ETH Falls 1% as Bulls Struggle to Break Above $2,600 Resistance

Cryptocurrency trading is speculative and your capital is at risk when you trade. We may earn affiliate commissions from some of the products on this page - at no extra cost to you.

The Ethereum price has slipped 1% in the past 24 hours, as ETH/USD trades at $2519. Its 24-hour trading volume has notably slumped 20% to $13.98 billion, suggesting a fall in market activity. This drop means that ETH is still down by 5% in a week and 23% in the last 30 days, with the alt retaining a 46% increase in the past year.
Meanwhile, data from SoSoValue shows that only three of the nine ETH ETFs experienced outflows. Cumulative net outflows reached $1.77 million on August 29.
Advertisement

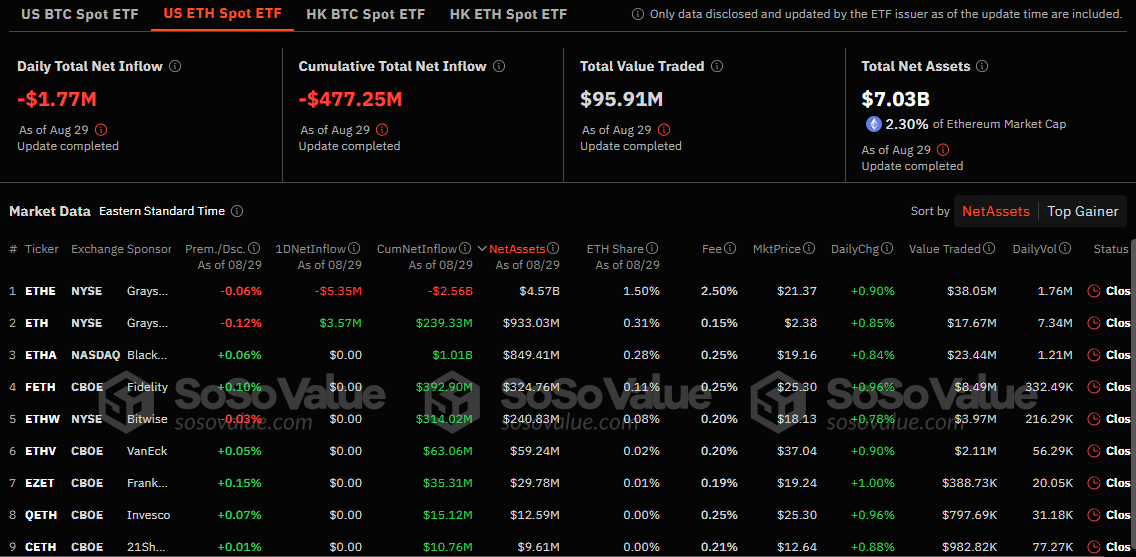
Despite the recent drop in price, Ethereum’s recent performance outpaced Bitcoin’s, suggesting that ETH could challenge Bitcoin’s dominance if it continues to show strength. Ethereum’s net inflow has also sparked optimism among investors, especially as Bitcoin’s net flow reached $71.71 million on August 29.
Ethereum Statistical Data
Based on CoinmarketCap data:
- ETH price now – $2,519
- ETH market cap – $302 billion
- ETH total supply – 120 million
- ETH circulating supply – 120 million
- ETH ranking – #2
The Ethereum bears capitalized on the death cross formed on August 7, causing the ETH price to drop. After the bulls hit significant resistance at $3,422, the price dwindled to an extended correction, with the bulls finding immediate support at $2,400. This has validated a bear flag pattern with a 16% target of $2,100. However, a reflex reversal to $2,519 suggests that more traders are buying the dip and may invalidate the potential downswing.
However, the ETH market’s technical outlook paints a bearish picture. The Ethereum price trades below major technical indicators, including the 50-day and 200-day Simple Moving Averages (SMAs). In this instance, the bulls must break above $2,927 and $3,256 to resume an uptrend.
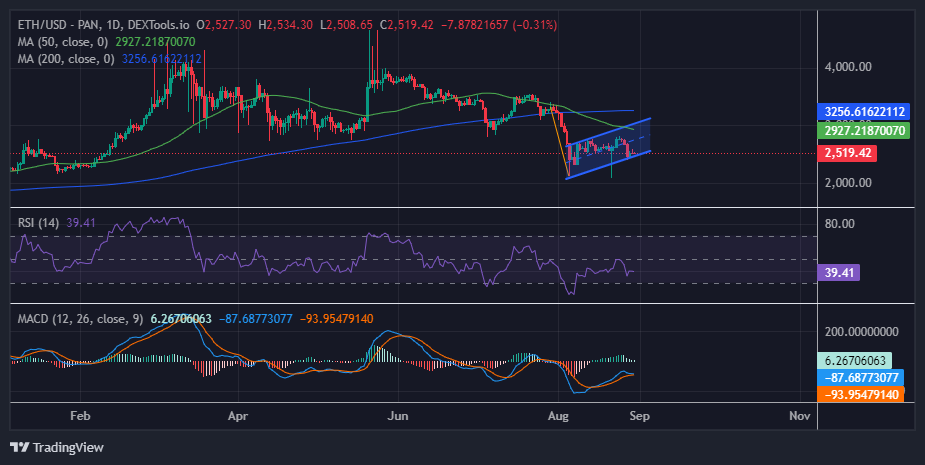
Nonetheless, the Relative Strength Index (RSI) is below the 50-mean level, validating the bearish thesis. The RSI sits at the 39 level, suggesting the altcoin is oversold. If the buyers increase their buying appetite, a move above $2,600 would imply that the alt is more robust and could reach $2,800.
On the other hand, the Moving Average Convergence Divergence (MACD) calls for traders and investors to rally behind ETH as it upholds a bullish outlook. The MACD indicator (blue) has crossed above the signal line (orange), suggesting a shift in momentum. Moreover, traders are inclined to buy ETH unless the MACD changes.
Ethereum Price Outlook
In the daily chart timeframe, the sellers have control of the market, with bulls nowhere to be seen. If the sellers keep dominating the market with the RSI and Moving Averages suggesting bearish prospects, the ETH price could plunge. Moreover, if the bears capitalize on the bearish flag pattern, they could breach the $2,400 support.
Often, a bearish flag suggests a continuation of a downward trend. The ETH price could test the $2,100 level in such a case. Conversely, the ETH price could increase with the MACD upholding a buy signal. The altcoin could surge in such a case, targeting the next resistance at $2,927.
Bottom Line
The Ethereum price analysis suggests a trend reversal is highly likely if support at $2,400 holds. Traders should focus on two fundamental levels ahead of September: support at $2,400 and resistance at $2,800. A break on either side of this range may determine the direction of the Ethereum price.
Advertisement


