


The Ethereum price is winning on the charts today, as it is up 3% in the past 24 hours, with the ETH/USD trading at $2,662. Accompanying its price movement is its 24-hour trading volume, which has gone ballistic by 17% to $12.21 billion, suggesting a rise in market activity among traders and investors.
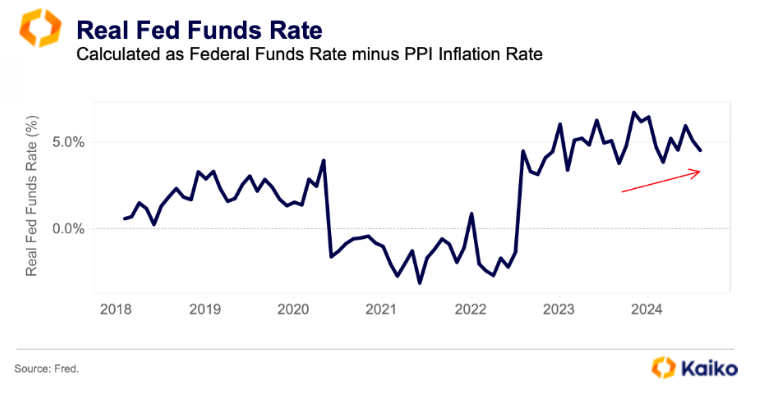
According to the Kaiko report, the recent price movement can be attributed to the decrease in gas fees. The reduction to a five-year low was propelled by soaring layer two protocol activity and the Dencun upgrade in March.
Advertisement

Moreover, the low transaction fees favor network users and ETH as an asset. This is because it results in less ETH being burned, which increases the token’s supply in the long term. The report has notably added that “despite demand drivers like spot ETH ETFs, this growing supply could dampen potential price increases in the near term.”
Ethereum Statistical Data
Based on CoinmarketCap data:
- ETH price now – $2,662
- ETH market cap – $320 billion
- ETH total supply – 120.29 million
- ETH circulating supply – 120.29 million
- ETH ranking – #2
Ethereum Price Aims for a BreakOut Above the Consolidation Phase
The Ethereum price shows signs of recovery, having flipped the $2,640 resistance to support floor. Although there is still a tug-of-war between the bulls and bears, forcing the price into a consolidation phase, the bulls are gaining momentum. Currently, the technical indicators flash bullish, tilting the odds toward the buyers.
To start with, the bulls have flipped the 50-day Simple Moving Average into a support floor at $2,640. However, they have a tussle as they target the next resistance key, which coincides with the 200-day SMA at $2,960. If the bulls flip the 200-day SMA into the support floor, they might initiate an uptrend, causing the ETH price to surge.
Notably, the Relative Strength Index (RSI) is above the 50-mean level, with its strength at 55. It has hurtled from the 30-oversold region as it moves towards the 70-overbought zone. Moreover, its position below 70 indicates there remains significant room for the upside before ETH is considered overbought.
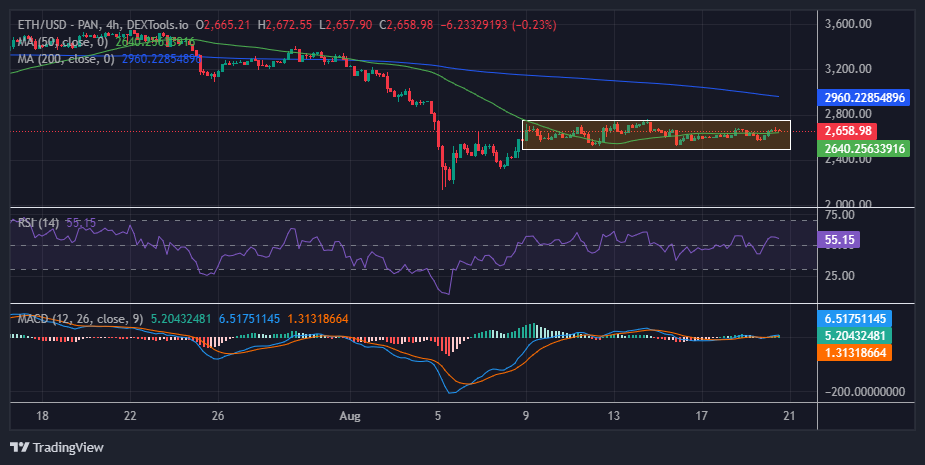
On the other hand, the Moving Average Convergence Divergence (MACD) is upholding a bullish outlook. The momentum indicator has flipped above the orange Signal line, calling for traders and investors to buy more Ethereum. Meanwhile, as the momentum indicator gradually ascends above the mean line (0.00) into the positive region, the path with the least resistance stays on the upside.
ETH Price Prediction
According to the technical outlook in the 4-hour chart analysis, the bulls have the upper hand. The price could rebound above 3,000 if the bulls capitalize on the RSI and MACD indicators, which call for traders to buy ETH. In such a case, the ETH price could break out of the consolidation phase, targeting the next resistance at $2,960. A rebound above $2,800 and $3,000 would imply a bigger rally toward $4,000 and the ATH.
Conversely, the ETH price could drop significantly if the bears take advantage of the 200-day SMA drop. In such a case, a breach and close below $2,640 will invalidate the bullish thesis. In a dire case where the altcoin slides lower, a candlestick close below $2,500 would trigger panic selling.
Advertisement


