Dogecoin Price Steadies Above $0.16 as Bitwise Spot DOGE ETF May Launch in 20 Days

Cryptocurrency trading is speculative and your capital is at risk when you trade. We may earn affiliate commissions from some of the products on this page - at no extra cost to you.

Highlights:
- The Dogecoin price is trading above $0.16 mark, as its daily trading volume soars 8%.
- The Bitwise DOGE ETF could launch in the next 20 days, according to Eric Balchunas.
- The technical outlook shows a potential rally in DOGE if the resistance zones give way.
The Dogecoin price is stabilizing above $0.16, with daily trading volume up 8%, indicating growing investor confidence. Eric Balchunas, an ETF analyst at Bloomberg, has said that the Bitwise Dogecoin spot Exchange Traded Fund (ETF) might be launched within 20 days of the 8(a) form submitted on Thursday.
Advertisement

The ETF analyst has noted via X that Bitwise revised its Dogecoin spot ETF application by submitting the 8(a) of the Securities Act of 1933. This is an automatic effectiveness application. The application would make this ETF legitimate and bring it into existence if the US Securities and Exchange Commission (SEC) does not intervene.
Provided that the current US government shutdown continues over the next 20 days, the DOGE ETF may be launched. Moreover, the prospective institutional inflows into the biggest meme coin may stimulate retail demand.
DOGE On-Chain Metrics Show a Potential Reversal
On the other hand, the Market Value to Realized Value (MVRV) is the ratio of the current price to the price of all tokens purchased, and it is used to determine unrealized profit/loss. It is also used to determine whether an asset is overbought or oversold.
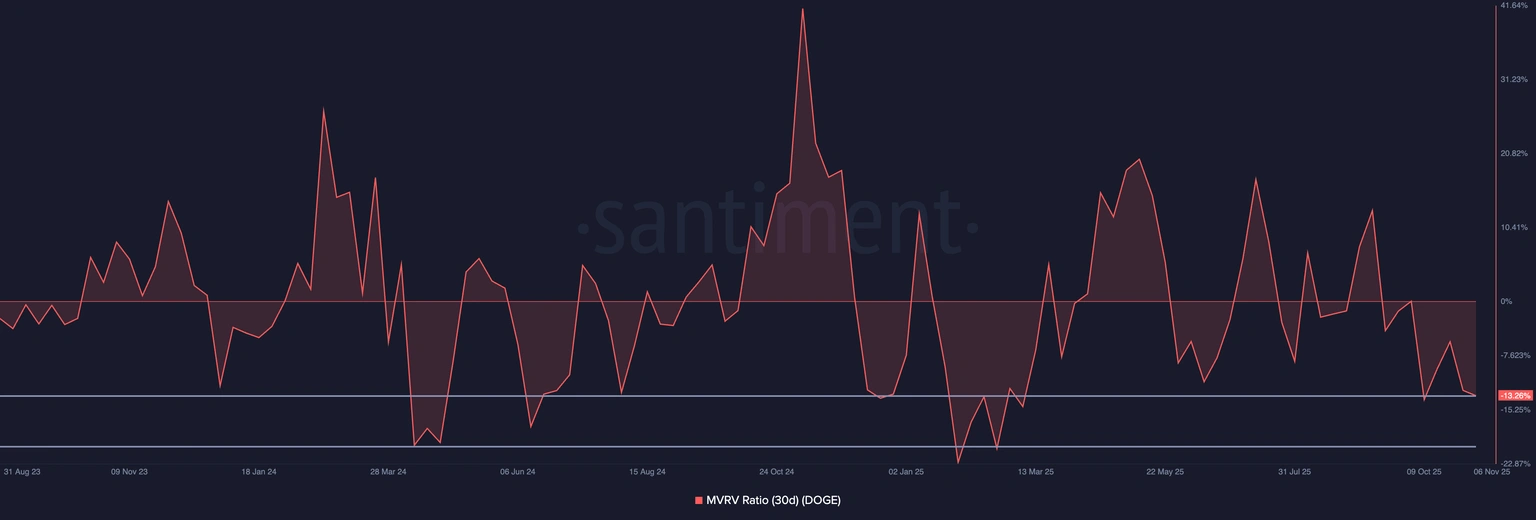
The 30-day MVRV over the past 7 days for Dogecoin is -13.26%, indicating that the coins purchased within the past 30 days are currently in a loss on their purchase price. Nevertheless, relative to the prior downcycle lows, DOGE is over enough of a sell to rebound.
Dogecoin Price Poised for a Breakout
The daily DOGE/USD chart displays a falling wedge pattern. The dog-themed meme coin is attempting a recovery, trading above $0.16. The 50-day ($0.21) and 200-day ($0.20) Simple Moving Averages (SMAs) on the 1-day chart are positioned above the price, signaling bearish momentum. These levels are acting as immediate resistance zones, cushioning the bulls against further upside.
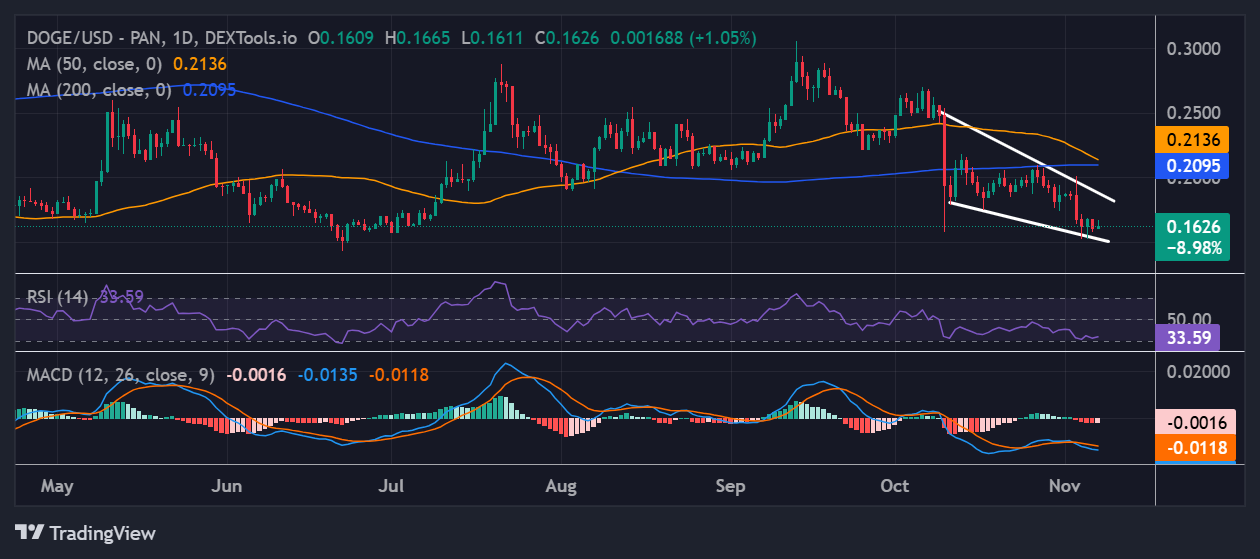
The Relative Strength Index (RSI) at 33.59 is hovering in oversold territory. If the bulls stage a buy-back campaign at this level, there could be a strong leg up toward the 50 mean level, invalidating the bearish bias. Meanwhile, the Moving Average Convergence Divergence shows a bearish crossover. This is evident as the signal line above the MACD line, a classic bearish momentum signal.
In the short term, Dogecoin price might test the $0.20 resistance if volume holds strong. In the long term, DOGE could aim for $0.52 to $1.00 by year-end. The chart’s breakout above the 200-day resistance would confirm this bias.
It’s not all smooth sailing. The RSI shows a possible consolidation phase before the next leg up. The Dogecoin price chart indicates opportunity, and the potential Bitwise DEGE ETF could add rocket fuel. Investors should watch for $0.20-$0.21 as the next resistance. Break that, and Dogecoin could be moon-bound.
![]()
eToro Platform
Best Crypto Exchange
- Over 90 top cryptos to trade
- Regulated by top-tier entities
- User-friendly trading app
- 30+ million users
![]()
eToro is a multi-asset investment platform. The value of your investments may go up or down. Your capital is at risk. Don’t invest unless you’re prepared to lose all the money you invest. This is a high-risk investment, and you should not expect to be protected if something goes wrong.
Advertisement


