Degen (Base) Surges 82% Following Coinbase Listing Roadmap Announcement

Cryptocurrency trading is speculative and your capital is at risk when you trade. We may earn affiliate commissions from some of the products on this page - at no extra cost to you.

The Degen (Base) price has surged 82% in the last 24 hours to trade at $0.008402 as of 3:15 a.m. EST on an 868% pump in trading volume to $81 million. now its market capitalization stands at $141.6 million.
Degen (Base) (DEGEN) is known for its vibrant community and unique approach to decentralized finance (DeFi). Like FET, DEGEN has also found its way into Coinbase. According to the exchange, DEGEN will be added to its listing roadmap, which means the token will eventually be officially listed on the exchange.
Advertisement

Assets added to the roadmap today: https://t.co/ZB01nl8WD5 (IO) and Degen (DEGEN)https://t.co/rRB9d3hSr2
— Coinbase Assets 🛡️ (@CoinbaseAssets) October 1, 2024
$DEGEN on Base is gaining significant momentum and is already up 5x in price, earning a spot on the list of high-conviction coins. Notably, the Smart Whale has been accumulating a substantial amount of $DEGEN just before the recent price surge.
DEGEN Statistics
- Degen (Base) Price: $0.008402
- Market Cap: $141.6Million
- 24-Hour Trading Volume: $82.3Million
- Circulating Supply: 16.91Billion
- Total Supply: 36.97Billion
Degen (Base) Price Spikes in a Parabolic Curve
The DEGEN/USD price action in a 4-hour timeframe highlights a recent surge in bullish momentum. Initially, the price trades a period of consolidation within the yellow box on the chart, moving sideways, indicating a balance between buying and selling forces.
This consolidation phase is often seen as a buildup before a significant price movement. Following the consolidation, the price broke out sharply, forming a steep upward curve resembling a parabolic move. This parabolic rise indicates strong buying pressure and a rapid price increase.
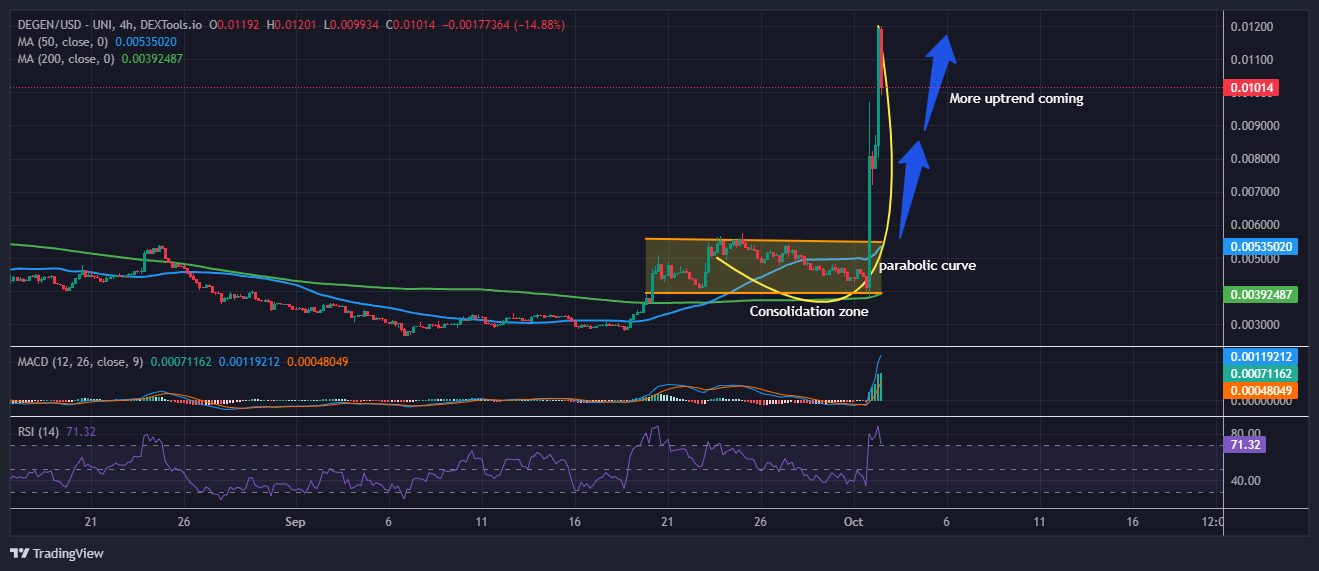
The upward blue arrows suggest that more upside could occur if the trend continues, indicating a potential bullish continuation. The simple moving averages (SMAs) shown in the chart, specifically the 50-period SMA (blue) and the 200-period SMA (green), also support the ongoing uptrend. Additionally, a moving average crossover is present, with the 50-period SMA crossing above the 200-period MA, forming a golden cross. This classic bullish indicator often suggests potential for further price appreciation.
The MACD (Moving Average Convergence Divergence) indicator reflects bullish sentiment. The MACD line is above the signal line, and the histogram bars are in positive territory, which aligns with the breakout from the consolidation zone and indicates strong upward momentum.
Additionally, the Relative Strength Index (RSI) is currently 71.34, suggesting that the asset is overbought. While this overbought RSI indicates strong buying interest, it also suggests a short-term correction or consolidation may occur before further continuation.
Bullish Momentum Signals Potential for Continued Uptrend
Based on the current chart analysis, the DEGEN/USD price shows strong bullish momentum, and a continuation of the uptrend seems likely in the short term. The breakout from the consolidation zone and the parabolic price movement suggest that bullish pressure is still strong. If the price can hold above the key support levels, it may continue to rise toward the next resistance level of $0.012.
However, given that the RSI is overbought territory, there may be a brief pullback or consolidation before the price can resume its upward movement. Traders should watch for any signs of exhaustion or reversal, particularly if the price fails to hold above key moving averages or breaks below the consolidation zone.
Advertisement


