Clover Finance (CLV) Price Drops 7.9% Amid Declining Volume, Analysts Predict Bullish Breakout

Cryptocurrency trading is speculative and your capital is at risk when you trade. We may earn affiliate commissions from some of the products on this page - at no extra cost to you.

Highlights:
- CLV is trading at $0.1023, with a 53% decline in trading volume to $177 million.
- Analyst “Crypto Signals” targets $0.30144 and $0.40321 for CLV/USDT based on a triangle pattern.
- Clover simplifies cross-chain interactions and enhances DeFi access using Polkadot’s Substrate framework.
The Clover Finance price is down 7.9% in the last 24 hours to trade at $0.1023 as of 2:30 p.m. EST on a 53% drop in trading volume to $177 million. The market capitalization currently stands at $102 million.
Advertisement

Analyst “Crypto Signals” highlights a potential bullish breakout for the CLV/USDT trading pair on the 12-hour chart. The breakout is marked by a triangle pattern signaling consolidation before an expected upward move. Based on resistance levels or Fibonacci extensions, target levels are set at $0.30144 and $0.40321.
Technical analysis indicates a potential bullish breakout for CLV/USDT on the 12-hour timeframe with targets at 0.30144 USDT and 0.40321 USDT.
👉 Trade CLV on MEXC: https://t.co/YIm4LOlGQS pic.twitter.com/v8w9JYFZeF
— Crypto | #1 Free Signals (@best_analysts) November 21, 2024
Confirmation requires increased volume and bullish momentum, supported by indicators like RSI or MACD. Traders are advised to exercise caution with a stop-loss below the triangle’s lower trendline to avoid false breakouts. Patience and proper risk management are key as market sentiment will influence the breakout’s success.
Clover Finance (CLV), launched in July 2021, is a blockchain operating system designed to simplify development and enhance compatibility across blockchains. Built on Polkadot‘s Substrate framework, it supports seamless cross-chain interactions, making decentralized finance more accessible.
CLV Statistics
- CLV price: $0.1023
- Market Capitalization: $102 million
- Trading Volume: $177 million
- Circulating Supply :1 billion
- Total Supply :1 billion
CLV/USD Breaks Out of Months-Long Consolidation
The CLV/USD pair has recently shown remarkable movement, emerging from a period of long consolidation with a sharp bullish breakout. For several months, the asset was trapped within a narrow range, leading traders to wonder whether the price would eventually break free. That breakout has now occurred, and the result has been a steep parabolic move, signaling strong buying pressure from investors eager to capitalize on the opportunity.
The surge has been substantial, pushing the price above two crucial moving averages—the 50-day MA at $0.0411 and the 200-day MA at $0.0495. These levels are vital in technical analysis, as breaking above the 200-day MA, in particular, is often seen as a significant bullish indicator. This suggests that there has been a shift in the long-term trend, moving from consolidation to a potential uptrend.
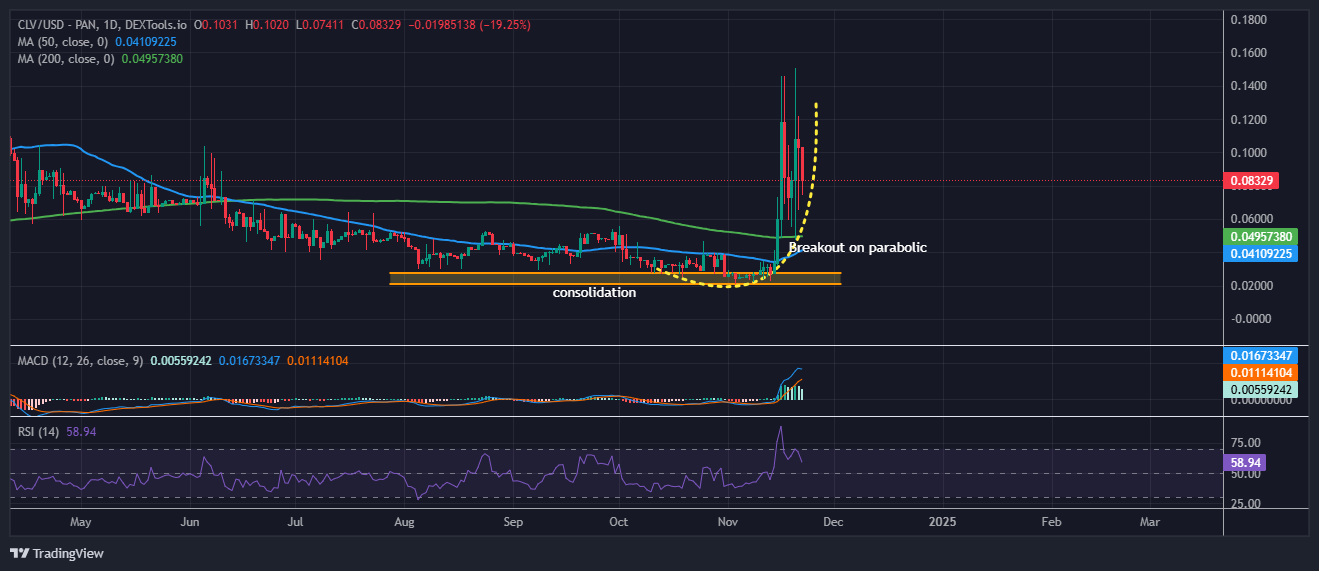
However, after reaching a recent high, the price has begun to retrace, now sitting at $0.08329. The retracement suggests that while there was an initial surge in buying interest, the price may be consolidating to find a new equilibrium.
Clover Finance Price Bullish Technicals Indicate a Short-Term Pullback
Technical indicators provide further insights into the current market sentiment. The MACD, which is a widely used trend-following momentum indicator, remains firmly in bullish territory, with the MACD line positioned above the signal line. This indicates that the buying pressure is still dominant. However, the MACD histogram has shown some signs of weakening momentum, which could be an early signal that the trend is losing steam and may experience a temporary pullback.
The Relative Strength Index (RSI), currently at 58.94, shows that the Clover Finance price is neither overbought nor oversold. This indicates that the asset has room to continue its bullish momentum, but it is not yet in an overbought position. Traders should keep an eye on the RSI as it approaches key thresholds, which could provide clues about whether the rally will continue or whether a correction is due.
Advertisement


