Cardano (ADA) Price Prediction: Bullish or Bearish

Cryptocurrency trading is speculative and your capital is at risk when you trade. We may earn affiliate commissions from some of the products on this page - at no extra cost to you.

Cardano (ADA) surged 3.99% in 24 hours, breaking out of a bullish falling wedge pattern. Technical indicators suggest further gains.
The price of Cardano (ADA) has increased significantly recently. It is trading at $0.415 today with a 24-hour trading volume of $250,265,975.37. This marks a 3.99% price rise in the last 24 hours and a 6.01% increase over the past seven days.
Advertisement

With a circulating supply of 35 billion ADA, Cardano’s market cap is valued at $14,722,271,786. These metrics show Cardano’s resilience and strength in the market despite being 86.64% below its all-time high of $3.09 recorded on September 2, 2021.
Price Performance and Market Position
Cardano’s recent price increase outperforms the global cryptocurrency market, which has only risen by 1.10% in the last seven days. Additionally, Cardano is outperforming the GMCI 30 Index cryptocurrencies, which have shown no movement over the same period.
This positive momentum can be attributed to several technical factors and bullish chart patterns observed in the analysis by experts like Captain Faibik and Dan Gambardello.
Falling Wedge Pattern and Breakout Confirmation
Captain Faibik’s analysis highlights a bullish outlook for Cardano following a confirmed breakout from a falling wedge pattern. A falling wedge pattern, known for its bullish reversal characteristics, indicates that the price movement has been confined within downward-sloping trend lines. The breakout from this pattern, marked by strong momentum, suggests a significant upside potential.
$ADA Falling Wedge Breakout is finally Confirmed after long Consolidation..✅
Expecting +70% Bullish Rally in Coming days..📈#Crypto #ADA #Cardano #ADAUSDT pic.twitter.com/MO5pTnOkZh
— Captain Faibik (@CryptoFaibik) July 2, 2024
The breakout is confirmed when the price breaks above the upper trend line of the wedge. In Cardano’s case, this breakout was evident on the chart, followed by a retest of the breakout level, further solidifying the bullish trend. Captain Faibik predicts a 70% rally from the breakout point, calculating the target by measuring the wedge’s height at its widest part and projecting it from the breakout point.
Technical Indicators Supporting Bullish Momentum
While Captain Faibik’s chart does not display additional technical indicators, they can further validate the breakout’s strength. Indicators like volume, Relative Strength Index (RSI), and Moving Averages are essential in confirming a bullish scenario. A significant increase in trading volume during the breakout would add confidence to the bullish outlook.
Dan Gambardello’s analysis supports the bullish sentiment, emphasizing the potential for Cardano to reach $1 before the altcoin season. He suggests that this milestone could mark the beginning of a parabolic ADA bull run.
Imagine Cardano gets back to $1 before altcoin season even starts.
It will be the starting line of the parabolic ADA bull run.
— Dan Gambardello (@cryptorecruitr) July 1, 2024
Daily and Weekly Chart Analysis
The daily chart of ADA/USDT on Binance, featuring technical indicators like RSI and MACD, provides further insights. The RSI value of 54.60 indicates bullish momentum, staying above the neutral 50 mark but below the overbought territory of 70.
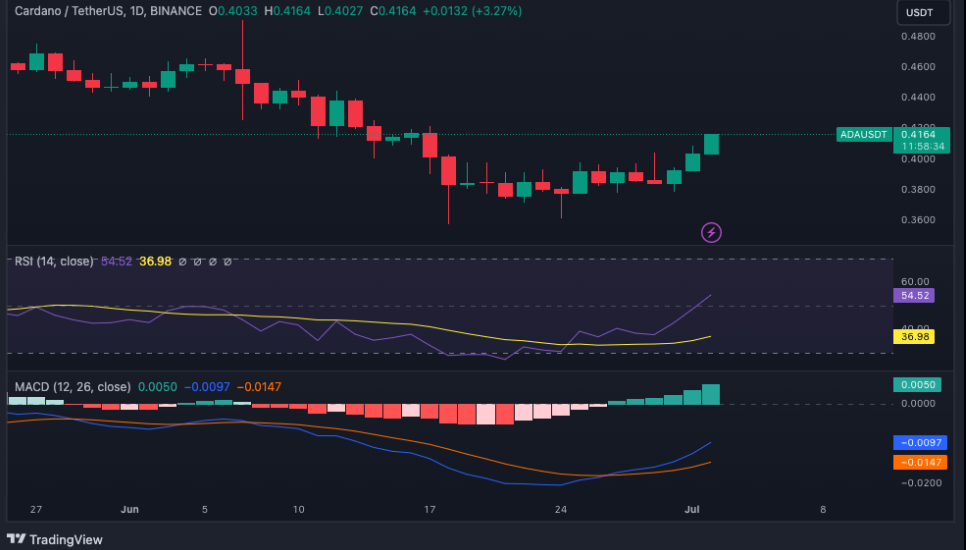
This suggests room for further upward movement. The MACD line, at -0.0097, is above the signal line of -0.0147, with positive histogram bars indicating strengthening bullish momentum.
The weekly chart of ADA/USDT on Binance reveals additional technical insights. The RSI value of 42.88, though below the neutral 50 mark, is trending upwards, suggesting a weakening bearish momentum.
The MACD line at -0.0191 and signal line at -0.0246, along with a negative histogram showing decreasing red bars, indicate a potential bullish crossover.
Read More
- Iris Energy Secures $413M for Bitcoin Mining Growth
- Best Meme Coins to Watch Closely in July 2024
- DePIN Crypto Projects to Watch In 2024 – Top 10 DePIN Coins
- Best Metaverse Coins to Invest – Next Metaverse Coins

Advertisement


