BTC ETFs Face Net Outflows, Breaking 7-Day Profit Streak

Cryptocurrency trading is speculative and your capital is at risk when you trade. We may earn affiliate commissions from some of the products on this page - at no extra cost to you.

Highlights:
- BTC ETFs saw their impressive profitable run end after registering net outflows in their October 22 data.
- ARKB topped the Bitcoin ETFs losses chart with over $100 million in outflows
- Ethereum ETFs experienced a profitable outing despite a drastically reduced activeness.
After seven consecutive days of recording massive net inflows worth over $250 million, Bitcoin (BTC) Exchange Traded Funds (ETFs) finally succumbed to net outflows in the October 22 flow data. According to SosoValue’s statistics, the Bitcoin entities witnessed roughly $79.09 million in losses. The registered net outflows stemmed from a heightened activeness reduction with an over $100 million recorded loss from ARK 21Shares Bitcoin ETF (ARKB).
Advertisement

💥BREAKING: Yesterday the spot #Bitcoin ETF saw $79.09 MILLION outflow! pic.twitter.com/nH9ToEtoBy
— Crypto Rover (@rovercrc) October 23, 2024
BTC ETFs Latest Statistical Report
Per SosoValue, only four Bitcoin ETFs attracted investors’ interest, while seven others had zero flows in their most recent outings. ARKB witnessed the only outflows at about $134.74 million. Three other entities registered profits. They include BlackRock Bitcoin ETF (IBIT) with $42.98 million, Fidelity Bitcoin ETF (FBTC) with $8.85 million, and VanEck Bitcoin ETF with $3.82 million.
Following the net outflows, Bitcoin ETFs’ cumulative net inflows dropped slightly to about $21.15 billion. Similarly, the total traded value declined to about $1.4 billion, while the total net assets reflected $65.12 billion. Despite the declines, the total net assets represented 4.88% of Bitcoin’s $1.328 trillion market capitalization.

Bitcoin Price Records Sideways Movement Around the $67,000 Region
Bitcoin’s price corrected slightly to stabilize around the $67,000 region as it mirrors the ETF commodities’ unfavorable showings. For context, the flagship cryptocurrency is changing hands at about $67,173, reflecting a 0.7% decline in the past 24 hours. Within the same time frame, BTC saw minimum and maximum prices ranging between $66,740.08 – $67,740.40.
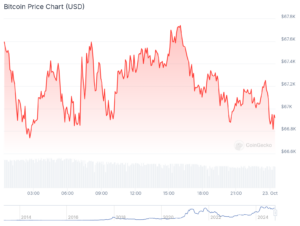
In its 7-day-to-date variable, BTC reflected a subtle 0.1% increment, with price extremes fluctuating between $66,852.38 – $69,227.75. Bitcoin’s minimum and maximum price levels in a 7-day interval underscores the token’s closeness to reclaiming the $70,000 price mark. Meanwhile, BTC’s 24-hour trading volume is down by about 22.06% with a $29.13 billion valuation. The plummeted trading volume signifies reduced activities.
Ethereum ETFs Experience Dull Outings
Unlike Bitcoin, Ethereum ETFs registered net inflows. However, the market experienced a significantly low activeness. BlackRock Ethereum ETF (ETHA) was the only active Ethereum ETF on October 22. It welcomed about $11.94 million in gains to sustain its position as the most profitable ETH commodity.
ETHA has contributed roughly $1.27 billion in cumulative net inflows, making it the only entity with over $1 billion in net inflows. Despite following ETHA closely, Fidelity Ethereum ETF (FETH) boasts less than half of the BlackRock Ethereum commodity valuation with about $498.02 million.
Moreover, Grayscale Ethereum ETF (ETHE) has plunged deep in losses, contributing to ETH ETFs’ unattractive outlook. ETHE has contributed losses of about $3.04 billion. Consequently, Ethereum ETF cumulative net inflows have continued to wallow in losses of about $488.85 million. The total value traded was $118.4 million, while the total net assets reflected $7.26 billion.

Ethereum Record Slight Momentum Drop in Price Actions
Despite netting in profits from its ETFs, Ethereum price movements mirrored the general market’s declining outlook. Notedly, the token has a $2,608 selling price, reflecting a 1.7% decline in the past 24 hours. Its weekly and monthly price change variables also displayed drops of about 0.3% and 1.8%, respectively.
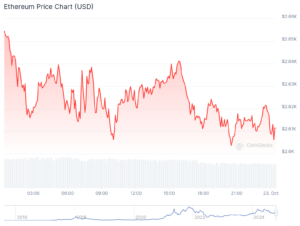
Meanwhile, Ethereum boasts about $313.88 billion in market capitalization. Its 24-hour trading volume has dropped by 18.59% with a $13.77 billion valuation.
Advertisement


