


Brett has seen a fluctuation over the past 24 hours, with a mixed performance throughout the day. The BRETT price has been trading in bullish patterns since early morning, reflecting a recovery from the earlier lows.
At the time of writing, Brett’s price is $0.1562. According to CoinMarketCap data, Brett’s market capitalization is approximately $1.55 billion, ranking it 52nd among other cryptocurrencies in market cap. The 24-hour trading volume shows a 2.17% increase, totaling around $51.79 million, suggesting active trading sessions.
Advertisement

Most of the Cryptocurrencies have seen a volatility with BTC, ETH, and other major coins experiencing significant price fluctuations. However the BRETT despite slight correction has maintained a relatively stable performance compared to its peers
Brett Price Forecast: Anticipated Surge to New Highs
Over the past week, Brett has experienced a notable increase in value, with prices fluctuating between $0.12 and $0.17. This week alone, the price of Brett surged by just over 10%.
Brett price has soared dramatically, a remarkable 116% increase in the past month. This surge has positioned Brett as the leading performer among the top 100 cryptocurrencies by market capitalization.
Notably, the price has already broken through the upper boundary of this wedge, a strong indicator of continued bullish momentum. If this upward trajectory persists, especially with increased trading volume, it would solidify the breakout’s validity.
In decentralized finance (DeFi), Brett has carved out a significant niche. The cryptocurrency is lauded for its innovative approaches and robust community backing. It capitalizes on DeFi mechanisms to offer users novel opportunities to earn passive income, such as staking and yield farming.
The combined allure of innovation and adventure encapsulated in Base Dawgz and its strategic functionalities underscores its potential to captivate a segment of the crypto community looking for dynamic investment opportunities.
Technical Indicators and Future Price Projections for Brett
Brett is currently recovering strongly from its recent dips, signaling a potential shift to a bullish market. This upward trajectory might soon surpass the resistance mark of $0.16. Should this positive trend continue, Brett could hit $0.20 and even climb to $0.30 in the near term.
Conversely, if market sentiment turns negative, Brett’s progress could stall. In this case, a fallback to a support level of $0.15 is likely. A further downturn might bring it down to approximately $0.13. Under extreme bearish conditions, Brett could be forced down to the critical support at $0.12, a clear sign of intense selling activity.
The daily technical indicators for Brett show a generally positive outlook. The Relative Strength Index (RSI) currently stands at 57, which points towards a neutral market momentum without entering the overbought or oversold territory. This indicates a balance between buyers and sellers, maintaining the price stable.
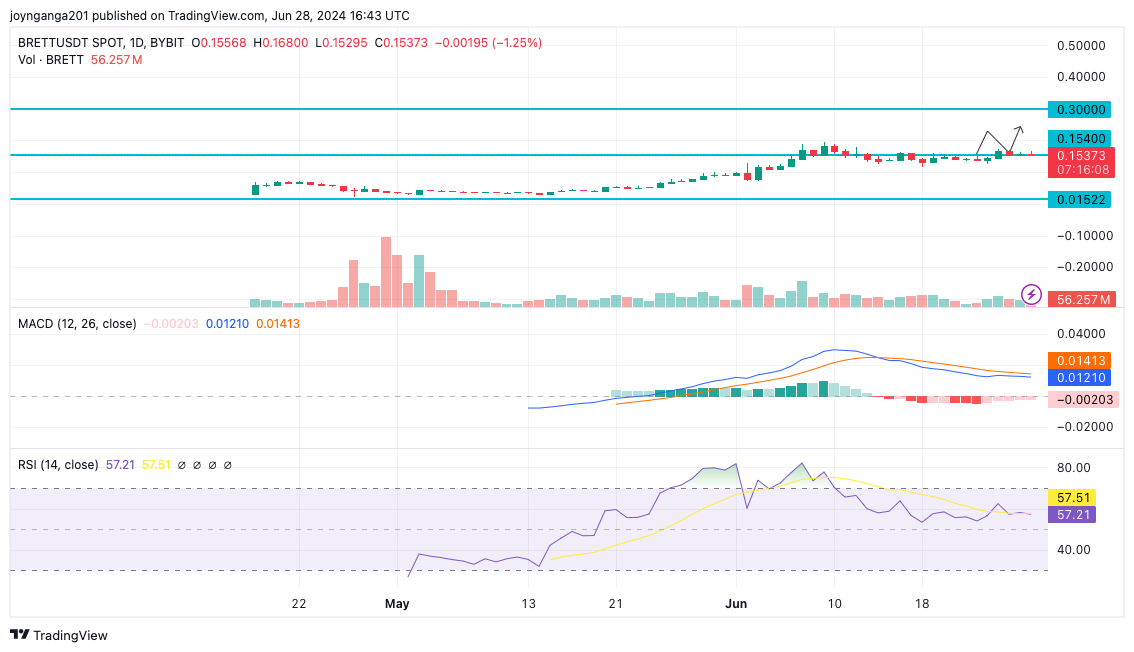
Meanwhile, the Moving Average Convergence Divergence (MACD) shows a mixed signal with the MACD line slightly above the signal line, reflecting a weak bullish signal amidst a generally flat trend. The histogram, showing minor fluctuations around the zero line, further confirms the lack of strong momentum in either direction.
Learn More
- Avalanche Price Prediction as AVAX Surges 10% Following ETF Speculation and Increased Trading Volume
- DePIN Crypto Projects to Watch In 2024 – Top 10 DePIN Coins
- Best Metaverse Coins to Invest – Next Metaverse Coins

Advertisement


