Book Of Meme Price Soars 27% as Analysts Predict Bullish Year-End Potential

Cryptocurrency trading is speculative and your capital is at risk when you trade. We may earn affiliate commissions from some of the products on this page - at no extra cost to you.

The Book Of Meme price has soared 27% in the last 24 hours to trade at 0.008876 as of 3:30 a.m. EST, fueled by a 161% surge in trading volume to $845 million. Now, the market capitalization stands at $666 million.
This comes as analysts point to a breakout from a descending triangle as the catalyst for this surge. The RSI has been above 70, which indicates possible consolidations ahead. The other signals, nonetheless, still move in their upward stride. Many think that it is going to be a bullish year-end, with BOME probably reaching $0.15, although it may pull back some time.
Advertisement

The meme coin is Book of Meme$BOME
> 500M marketcap
> 300M volume today alone
> 112M on #BinanceTrue cabal coin with a completely bottomed out setup https://t.co/BE12mXsUpz pic.twitter.com/55TzeYm4EV
— CryptoShadow 👑 (@CryptoShadowOff) October 13, 2024
The sudden gain in the price of the Book of Meme token has drawn attention and placed it in trending status on CoinmarketCap. However, compared with its prime days, the token is much below the user’s expectations. Its value was as high as $0.02805 in early March.
BOME Statistics
- BOME price: $0.008876
- Market Capitalization: $666 million
- Trading volume: $845 Million
- Circulating supply: 68 million
- Total Supply: 68 million
Book Of Meme Price Continues the Uptrend: Can the Bulls Sustain the Momentum
The price chart of BOME creates a rounded bottom pattern, suggesting that the previous bearish trend is likely to reverse into a bullish one. It also clearly indicates a bullish breakout, with the price managing to break above the neckline of $0.009045 for confirmation of the breakout and probably the beginning of the uptrend.
The Simple Moving Average, 50 SMA is $0.00673225, while the SMA 200 is $0.00669797. An SMA crossover might be looming: the 50-day MA could cross the 200-day what’s known as a golden cross. That’s a strong bullish signal showing that the uptrend is well-supported and likely to continue.
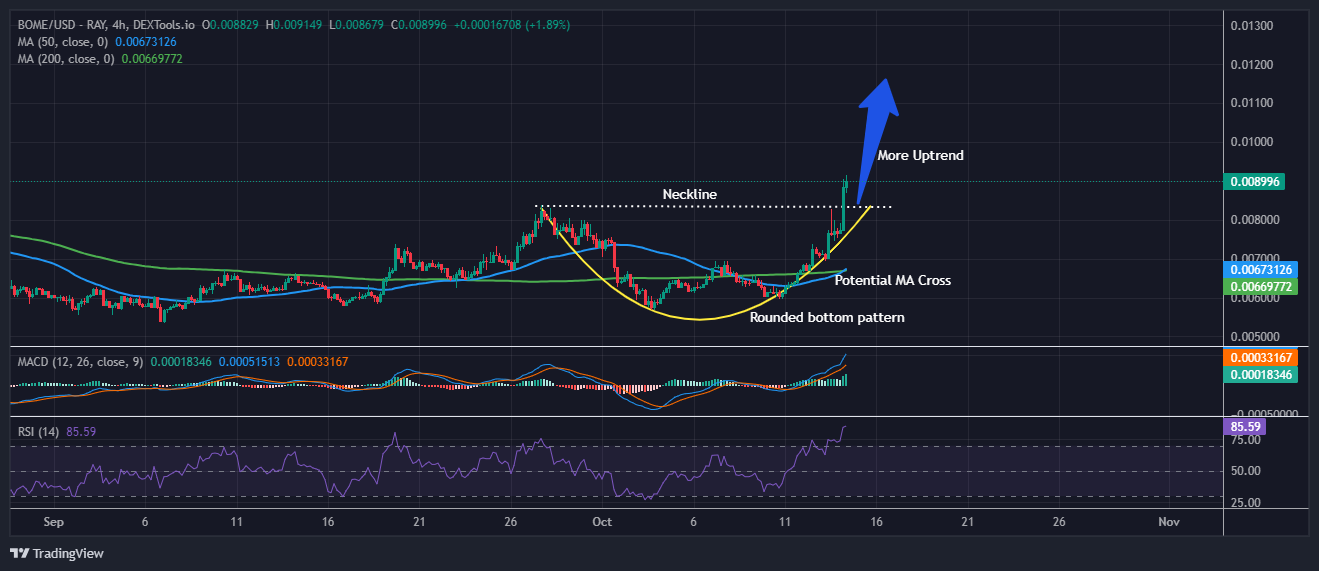
This is further reflected in the supportive MACD for such a bullish view. The MACD line has crossed the signal line at 0.000518 and 0.000333, respectively, indicating an increase in buying pressure. The growing momentum on the buy side is further confirmed by a rising MACD histogram.
BOME Bullish Technical Indicate a Short-Term Reversal
However, the current RSI is 85.85, meaning it, too, has reached deep into the overbought zone. This would indicate that even though the general trend is upwards, after such a steep rise in such a short period of time, there may well come a partial pulling back or consolidation before the next upward movement.
A breakout point at $0.009045 is an important marker, with the next potential resistance levels around $0.01 and $0.012. The upside resistance would be met around the $0.01 and $0.012 levels, but downside support on its own falls around the $0.0067 level, which corresponds to the 50-day and 200-day moving averages. If this line is broken, it would be a potential reversal toward the bullish stance that there is any chance of correction.
Conclusion Drawing from the chart, while most indicators are showing strong bullish momentum and upside, the overbought RSI suggests some consolidations or a minor pullback may be in store before continuation. The next reasonable targets are $0.01 and $0.012, with critical support around $0.0067.
Advertisement


