Blur Price Plunges 13% as Technical Indicators Signal Suggest a Resurgence

Cryptocurrency trading is speculative and your capital is at risk when you trade. We may earn affiliate commissions from some of the products on this page - at no extra cost to you.

Over the past 24 hours, Blur’s price has declined 13%, trading at $0.2045 as of 4:19 a.m. EST.
The trading volume for BLUR pairs has surged by 285% to $226 billion, indicating strong market activity. This increase suggests that speculators are actively engaging in the process of capitalizing on the excitement surrounding the introduction of Blast.
Advertisement

Additionally, whales are buying BLUR. The latest price is $0.2138, reflecting an 11.687% drop. Over the past week, there have been 6 alerts. The 24-hour trading volume has reached $226 million. Market sentiment remains relatively positive, scoring 7 out of 10, with a manageable risk assessment of 4 out of 10.
Whales are buying #BLUR 🐳 ❇️
Last price: 0.2138 (-11.687%)
Alerts in last 7 days: 6
24h Volume: 58.19M USDT
Score: 7/10 | Risk: 4/10 $BLUR #Crypto pic.twitter.com/Sq1fMO4WIr— FishTheWhales 🐳 (@FishTheWhales) June 27, 2024
Blur Price Statistics
- BLUR price: $0.2045
- Marke cap:$353 million
- Trading volume: $226 million
- Circulating supply: 1.7 billion
- Total supply: 3 billion
BLUR Price Could Rebound to Initiate a Rally
Over the past day, BLUR’s price indicates a push and pull between the bulls and bears has rebounded strongly from the crucial support level at $3.17.
Currently, BLUR is attempting to break through a medium-term downtrend line visible on its charts. If it manages to surpass this obstacle within the next 8 hours, it aims to reach the resistance level at $0.49642
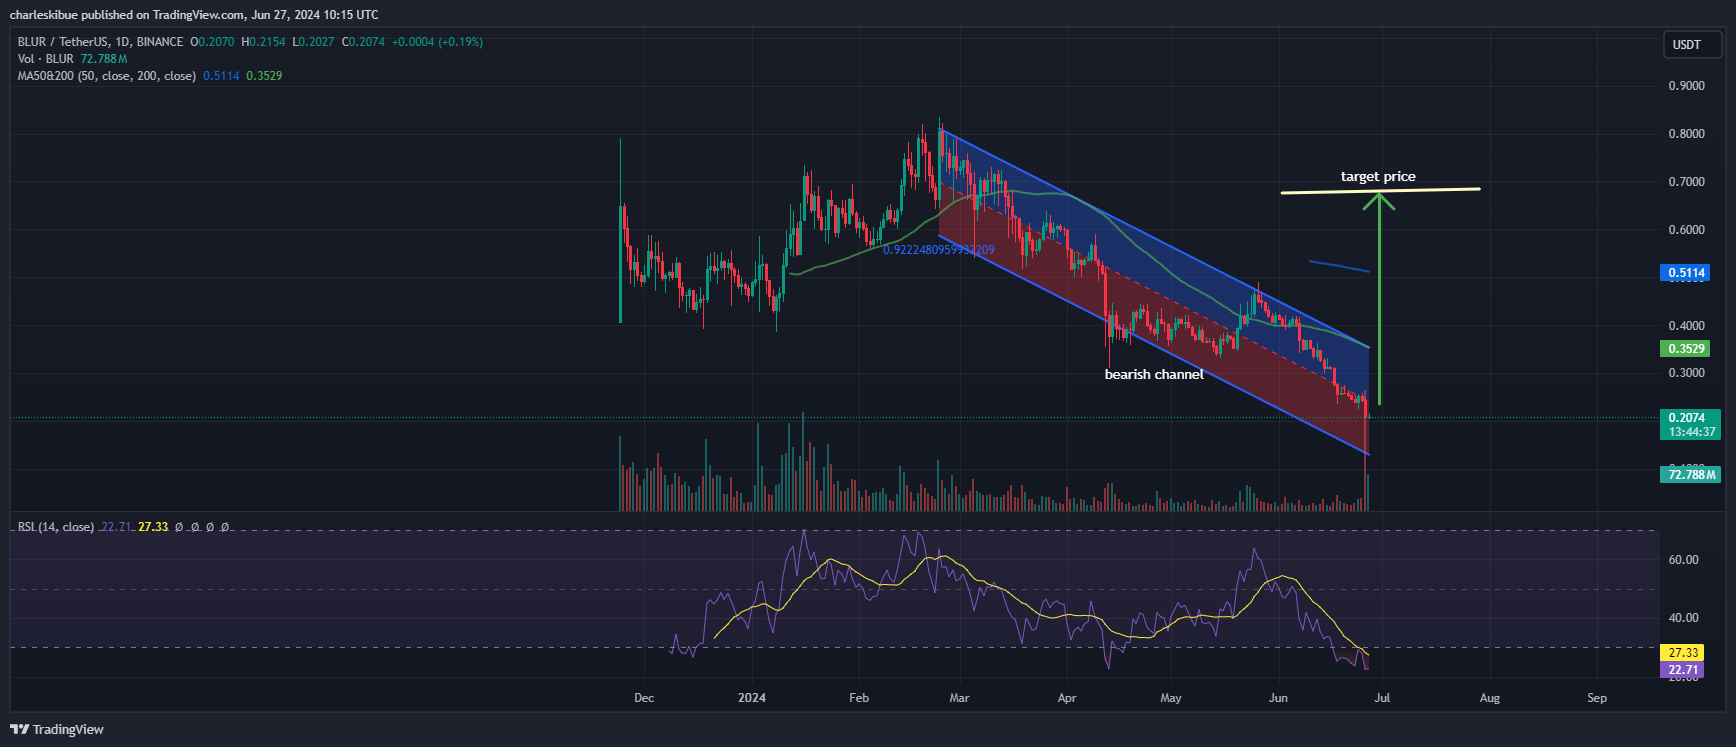
BLURUSD Chart Analysis. Source: Tradingview.com
If the bullish momentum continues, $0.2434 could become a new support level, potentially propelling BLUR even higher over the next 24 hours. A successful breakthrough above the channel could pave the way for BLUR to target as high as $0.7515 in the short term.
However, if BLUR fails to close a 4-hour candle above the descending trend line, it could undermine the bullish outlook. In such a scenario, BLUR might retest the immediate support at $0.1317. Further downward pressure could lead to BLUR establishing a new all-time low if bears manage to push the price below this critical level.
Technical Indicators Suggest Potential for Price Rebound
The Moving Average Convergence Divergence (MACD) and Relative Strength Index (RSI) both indicate increasing buyer strength.
The MACD line crosses above the MACD Signal line, a move typically seen as a bullish signal, suggesting BLUR might be entering a short-term uptrend. The widening gap between the MACD lines further indicates strengthening bullish momentum.
Additionally, the RSI is currently below the 30 oversold level, indicating that the buyers maybe regrouping to surge to the 50 mark. This could provide an opportunity for bulls to initiate long positions. As the RSI starts to stabilize, it supports the idea that BLUR’s upside potential is greater than its downside risk in the near term.
If the surge occurs, the mid-term target for BLUR could approach 80 cents. However, a pennant pattern is currently in play, and a dip below the lower trendline could invalidate the bullish trend. Conversely, a breakout above the upper trendline would support the continuation of the cup-and-handle formation.
On the positive side, the RSI is still making higher highs without entering the overbought region. Additionally, there is a bullish divergence compared to the price action, which bodes well for the price of BLUR.
Read More
- Toncoin Price Prediction: Can TON Hit $10 Soon as USDT Circulation Surpasses 500M?
- DePIN Crypto Projects to Watch In 2024 – Top 10 DePIN Coins
- Best Metaverse Coins to Invest – Next Metaverse Coins

Advertisement


