Bitcoin Price Surges to $60,791 as U.S. Inflation Data Shows Mixed Results for September

Cryptocurrency trading is speculative and your capital is at risk when you trade. We may earn affiliate commissions from some of the products on this page - at no extra cost to you.

Bitcoin price has surged by 0.3% in the last 24 hours to trade at $60,791 as of 5:18 a.m. EST on a 6.6% plunge in trading volume to $30 billion. The market cap is now at $1.2 trillion. This comes as the US consumer price index (CPI) increased a seasonally adjusted 0.2% in September, putting the annual inflation rate at 2.4%. Both were 0.1 percentage points higher than expected.
The September consumer price data presents a mixed picture. The annual inflation rate continues to cool, hitting its lowest point in three years, though the report came in slightly higher than expected. According to the Labor Department, the consumer price index (CPI), which measures the cost of everyday goods and services, increased by 0.2% in September from the previous month and rose 2.4% year-over-year.
Advertisement

In case you missed it: US Sep consumer price #inflation data is hotter than predicted by a tenth of a percentage point for both headline CPI and core CPI (2.4% and 3.3% YoY). Core has accelerated slightly again. Food prices accelerated to +0.4% MoM (up from +0.1% in Aug). pic.twitter.com/XuJAAxwigy
— Holger Zschaepitz (@Schuldensuehner) October 10, 2024
Economists had anticipated inflation would slow to 2.3% annually and rise 0.1% month-to-month. Meanwhile, core prices, which exclude volatile categories like food and gasoline, climbed 0.3% month-over-month and were up 3.3% from the previous year—both slightly above economists’ forecasts of 0.2% and 3.2%, respectively.
Persistently high inflation continues to strain U.S. households financially, particularly affecting lower-income Americans who spend a greater share of their income on necessities, leaving little room for savings. A significant contributor to the rise in core inflation was shelter costs, which increased by 0.2% from August. Over the past year, shelter prices have risen 4.9%, making up more than 65% of the total 12-month increase in core inflation (excluding food and energy).
Bitcoin Statistics
- Bitcoin price: $60,791
- Market cap: $1.2 trillion
- Trading volume: $30 billion
- Circulating supply: 19 million
- Total supply: 21 million
Bitcoin Price Bulls Regain Strength for an Upcoming Bullish Rally
The price of Bitcoin has recently experienced contradicting forces caused by bears and bulls. This has led to the formation of a cup and holder pattern, indicating a high chance for a bullish trend to occur. The bulls are seen pushing Bitcoin high after retreating from the $59,777 support level, with the aim of creating a bullish breakout at the upper trendline of the bearish channel.
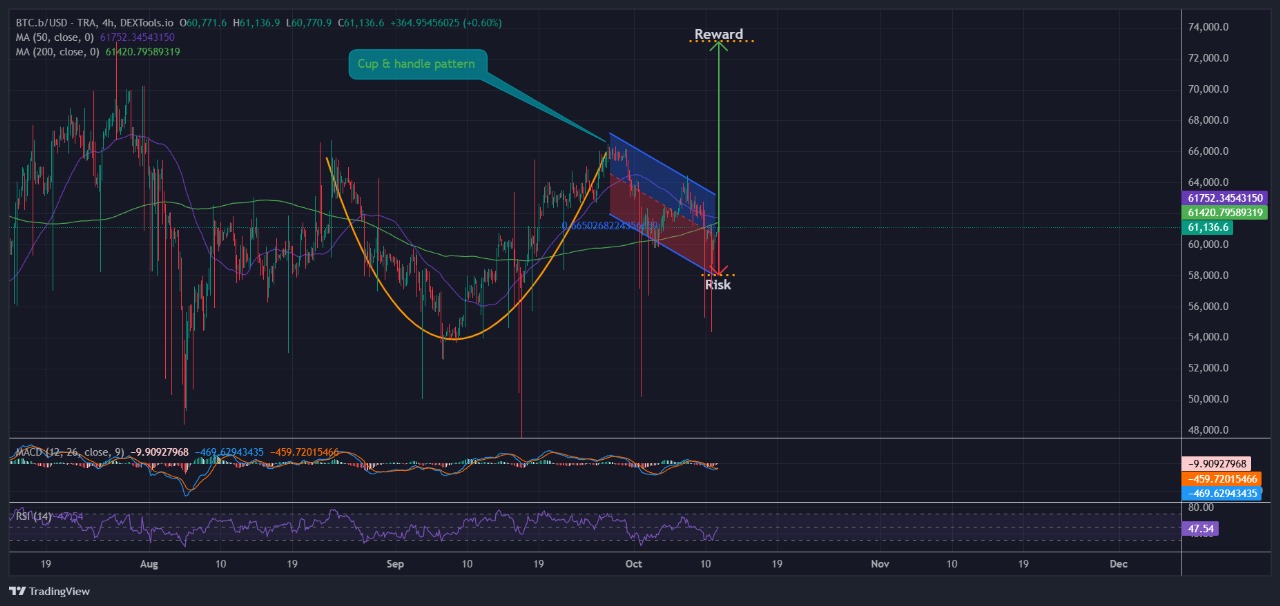
The BTCUSD price is currently trading below both the 50-day and 200-day simple moving averages (SMA). This is all about to change since the Bitcoin price is on track to cross over both the 50-day and 200-day SMA. After Bitcoin price surpasses both SMAs, the SMAs will act as key support levels of the market. This will strongly suggest the probability of an upcoming bully rally.
Technical Indicators Support an Upcoming Bully Rally
The relative strength index (RSI) also sides with the probability of an upcoming bully rally. The RSI is currently flowing at 47.54, heading towards the 50-midline level. If the RSI manages to cross above the 50-midline level, the RSI will highly favor the likelihood of a bully rally to occur.
Additionally, the moving average convergence divergence (MACD) also supports the probability of a bully rally. The red histogram bars are seen decreasing in size and number as they fade out in color. On the other hand, the blue line of MACD is seen rising so as to cross over the orange signal line. If the blue line manages to cross over the orange signal line, it will indicate a shift in Bitcoin price from a bearish to a bullish sentiment.
If the bulls take over the market, they will form a bullish breakout at the bearish channel. The bulls will aim at a $73,126 target price. On the other hand, if the bears continue to be in charge, they will push the price lower to $58,053.
Advertisement


