


Highlights:
- Bitcoin price skyrockets by 3%, reclaiming the $68,000 mark
- BTC ETFs have recorded massive inflows worth over $300 million
- Coinglass data indicate that the BTC price is bullish, as the BTC Long/Short position rises above 1.
The Bitcoin price is upholding a bullish muscle as it has surged 3%, with BTC/USD trading at $68,055. The growing interest in the token has seen the trading volume spike by more than 39% to $53.02 billion, while the market cap is up 3% to $1.34 trillion. BTC is now up 7% in a week, 16% in a month, and 144% in a whole year.
Advertisement

The positive price outlook comes as the BTC ETFs record massive inflows worth over $300 million for the third consecutive day. BlackRock Bitcoin ETF (IBIT) has finally outpaced Fidelity Bitcoin ETF (FBTC) by an enormous margin, as it welcomed $288.84 million in gains, while FBTC recorded $35.03 million.
JUST IN: #Bitcoin ETFs had $1.43 BILLION inflows in the last 3 days. pic.twitter.com/Zmmpk3kR9K
— Bitcoin Archive (@BTC_Archive) October 16, 2024
Data from Coinglass suggests increased investor confidence, painting the big picture in the BTC market as bullish. This is evident as the BTC Long/Short Ratio has risen above 1, currently at 1.05. In other words, a close above 1 indicates that the average open position is bullish, and vice versa.
Bitcoin Statistical Data
Based on CoinmarketCap data:
- BTC price now – $68,055
- Trading volume (24h) – $53.02 billion
- Market cap – $1.34 trillion
- Total supply – 19.77 million
- Circulating supply – 19.77 million
- BTC ranking – #1
Will the BTC Bulls Maintain the Pace?
The Bitcoin price has flipped bullishly, steadily rising within the rising parallel channel, reclaiming the $68,000 mark. The pioneering cryptocurrency has increased since October 10, following the support establishment at $63,181. This confluence area, which had brought together the 50-day Simple Moving Average (SMA) (green)at $63,181 and the 200-day SMA (blue) at $62,620, marked the turning point into what later became a significant rally.
Trading above all the moving averages, including the 50-day EMA (green) and 200-day in (blue), has reduced the sellers’ influence, leaving Bitcoin’s price in a resistance-free zone.
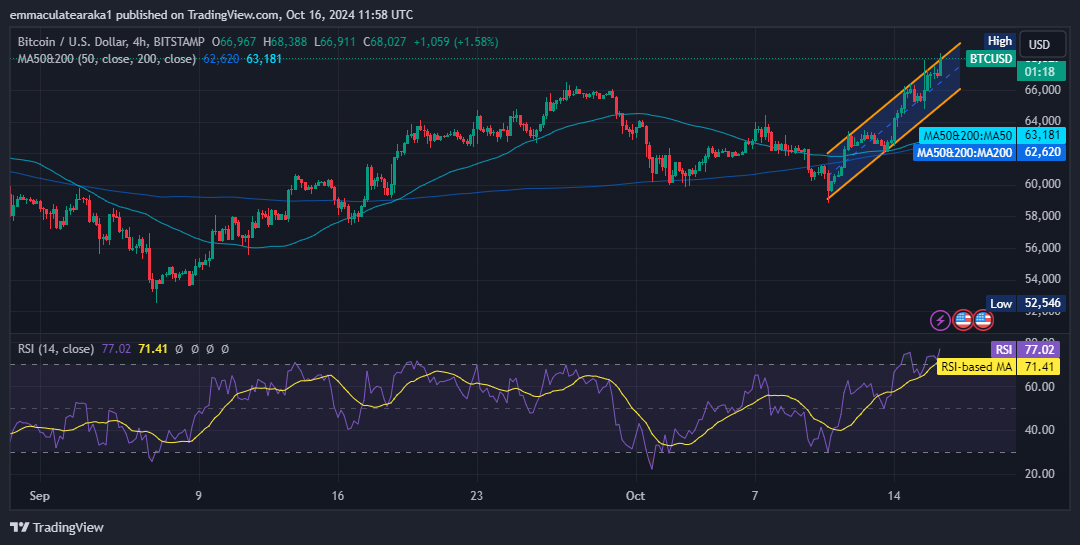
As expected, early-profit booking may commence, leading to a slight retracement in the market. That said, traders are advised to be cautious as the Relative Strength Index (RSI) sits at the 77.02-overbought region. A retracement will likely follow, allowing BTC to sweep through more liquidity as already sidelined investors rush to buy lower-priced Bitcoin tokens.
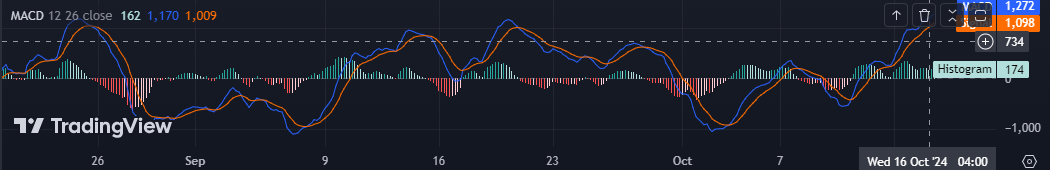
Meanwhile, traders are at liberty to hold their long positions in MACD intact, bolstered by the bullish outlook from the Moving Average Convergence Divergence (MACD) indicator. A buy signal validated the rally with the blue MACD line stepping above the signal line in orange. The momentum indicator has also jumped into the positive region – above the mean line at 0.00. This outlook signals intense buying pressure, calling for traders to rally behind BTC.
Bitcoin Price Outlook
The Bitcoin bulls have put their best foot forward, quashing the seller congestion in the market. Increased buying appetite at this level could potentially see the BTC price reach $70,074. Conversely, the RSI’s overbought conditions might culminate in a reversal.
It is prudent to watch out for the RSI’s rejection from the overbought region to time the reversal and avoid the bull trap carefully. In such a case, the $65,257 support level will cushion against downward pressure. Intense selling pressure will see the $63,181 mark(coinciding with the 50-day SMA) absorb the losses.
Advertisement


