Bitcoin Price Prediction: Chart Patterns Signal a BTC Surge to $70k


Highlights:
- Bitcoin is trading in a symmetrical triangle, indicating an impending breakout
- A bullish breakout could see BTC surge to $70k
- A confluence of bullish macro factors supports such a price rally
Bitcoin has experienced a slight downturn today, dipping by 3.30% to trade at $58,106 at the time of writing. Despite this minor pullback, the prevailing sentiment among analysts suggests that Bitcoin could be on the verge of a significant price breakout, potentially driving it to new highs in the coming weeks.
Advertisement

Current Market Dynamics and Technical Indicators
Bitcoin’s price is consolidating within a symmetrical triangle, a chart pattern that typically signals an impending breakout. This formation has garnered attention from traders and analysts, as it often precedes sharp price movements. The critical question now is whether Bitcoin will break out upwards or downwards.
If Bitcoin breaks out on the bullish side of the triangle, the first target could be $68,218, a level that many traders are eyeing. Such a breakout would likely be fueled by increasing buying volumes, signaling renewed investor confidence in the cryptocurrency.
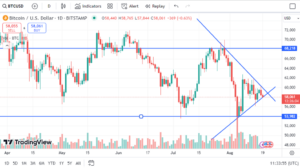
On the other hand, a bearish breakout could see Bitcoin tumble to around $53,982, representing a potential downside risk in the short term. However, current market indicators suggest that the odds favor a bullish breakout.
Macro Factors Supporting a Bullish Breakout
Several macroeconomic factors are tilting the scales, favoring a bullish breakout for Bitcoin. One of the most significant is the anticipation that the Federal Reserve will begin cutting interest rates as early as September. This expectation has already sparked a rally in the stock market, with many investors seeking riskier assets in the face of a potentially more accommodative monetary policy. Bitcoin, often seen as a hedge against inflation and currency devaluation, could benefit significantly from this shift.
Moreover, Bitcoin’s adoption continues to grow, particularly among institutional investors. Companies like MicroStrategy have steadily increased their Bitcoin holdings, signaling long-term confidence in its value proposition. Additionally, Bitcoin exchange-traded funds have seen positive money flows, indicating that institutional money is increasingly bullish on Bitcoin.
These factors, combined with Bitcoin’s limited supply of 21 million coins, make a strong case for a potential price surge. With demand likely to rise as more investors and institutions adopt Bitcoin, the supply-demand dynamics could push prices significantly higher. Macro factors and institutional interest boost the odds of a BTC surge to $70k.
Historical Context: Bitcoin’s Halving Cycles
Bitcoin’s current price movement aligns with historical patterns observed in previous halving cycles. Historically, Bitcoin has reached new all-time highs (ATHs) within a certain period following each halving event.
Knight Triver, a well-known Bitcoin analyst on X, recently pointed out the timelines for Bitcoin reaching its ATHs after each halving:
- 2012 Halving: It took Bitcoin approximately 367 days to reach its ATH.
- 2016 Halving: Bitcoin hit a new ATH after about 526 days.
- 2020 Halving: The cryptocurrency reached its ATH in 548 days.
As of August 17, 2024, it has been 119 days since the most recent halving, which occurred earlier this year. Based on historical trends, Bitcoin is still within the expected timeframe to reach a new ATH. If history repeats itself, Bitcoin could be on track to achieve substantial gains by mid-2025, potentially reaching hundreds of thousands of dollars per coin.
This is how long it took BTC to hit ATH's after each bitcoin halving.
After the 2012 halving, Bitcoin took approximately 367 days to reach its all-time high.
After the 2016 halving, it took about 526 days for Bitcoin to hit its new all-time high.
After the 2020 halving,… pic.twitter.com/sVDogVsk9q
— Knightriver (@Knightriver2112) August 17, 2024
Conclusion: Bitcoin’s Path Forward
While Bitcoin has experienced a slight dip in price today, the broader outlook remains highly optimistic. The symmetrical triangle pattern, favorable macroeconomic conditions, and ongoing institutional adoption indicate a high probability of a bullish breakout soon. Additionally, Bitcoin’s historical performance following halving events suggests that significant gains could be on the horizon.
Advertisement


Syed Ali Haider
Ali Haider is a contributing crypto writer at Crypto2Community. He is a crypto and blockchain journalist with over six years of experience and has long advocated for digital freedom and cybersecurity. Haider has been featured in several high-profile crypto and finance outlets, including Coincult, AltcoinBeacon, BTCRead, and more.
View full profile ›ℹ️About Crypto2Community's Editorial Process
Crypto2Community's editorial policy is centered on delivering thoroughly researched, accurate, and unbiased content. We uphold strict editorial policy and sourcing standards, and each page undergoes diligent review by our team of top crypto industry experts and seasoned editors. This process ensures the integrity, relevance, and value of our content for our readers.