


Bitcoin price has plunged 1% today, and the broader crypto market is riding the wave. At the time of writing, the BTC token was trading at $66,885 despite its 24-hour trading volume surging 45% to $44.41 billion.
This comes as BlackRock’s iShares Bitcoin Trust (IBIT), the world’s largest asset manager, accumulated $526.7 million in net inflows on July 22. This is the most significant fund intake IBIT has recorded since March. Moreover, BlackRock purchased 7,759 Bitcoin on July 22, bringing its total sum to 333,000 BTC, amounting to about $22 billion.
Advertisement

Bitcoin ETF Daily Flow
Blackrock US$ Flow: 526.7 million
For all the data and disclaimers visit:https://t.co/4ISlrCgZdk
— Farside Investors (@FarsideUK) July 23, 2024
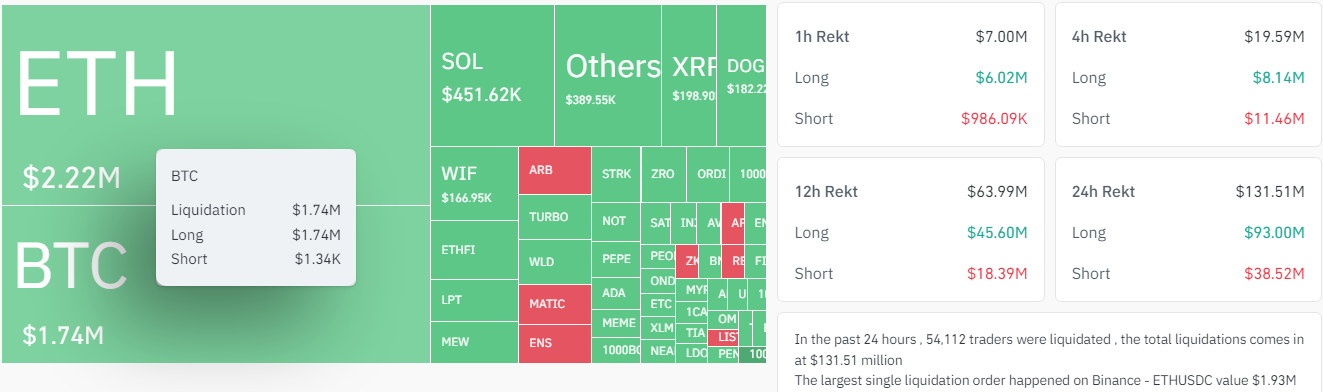
On the other hand, data from Coinglass shows that approximately $131 million in crypto liquidations accompanied Bitcoin’s return above $65,000. This included $1.34K short BTC positions and $1.74 million long liquidations.
Meanwhile, crypto investors have set their sights on the Bitcoin 2024 Conference, which will be held in Nashville, Tennessee, from July 25 to July 27. With billionaires from different industries, including Donald Trump, lined up on the attendance list, the BTC community’s hopes remain high.
Speakers at Bitcoin 2024 Conference 26-27 July 2024 pic.twitter.com/cG4tdX1qu7
— MartyParty (@martypartymusic) July 20, 2024
Bitcoin Statistical Data
Based on Coinmarketcap data:
- BTC price now – $66,885
- BTC market cap – $1.32 trillion
- BTC total supply – 19.73 million
- BTC circulating supply – 19.73 million
- BTC ranking – #1
Bitcoin Price Poised for a Surge Above the Ascending Triangle
The Bitcoin price has been on a tear in July, surging over 10% in the past two weeks. The token soared from its low of $58,000 support zone to $68,444, which acted as the immediate resistance zone. However, the price of Bitcoin fluctuated within an ascending triangle pattern.
Holding the BTC price in place is an ascending trendline, forming part of the triangle on the four-hour chart. Support at $66,472 is essential for the resumption of the uptrend, as the bulls are attempting to break above the governing pattern.
Most traders and investors use the ascending triangle pattern to identify potential profitable opportunities. In layperson’s language, it is easier to interpret the pattern as a continuation pattern. As the chart below shows, an ascending triangle pattern consists of two trendlines: a horizontal line connecting the swing highs and acting as resistance and a rising line connecting the swing lows and acting as support.
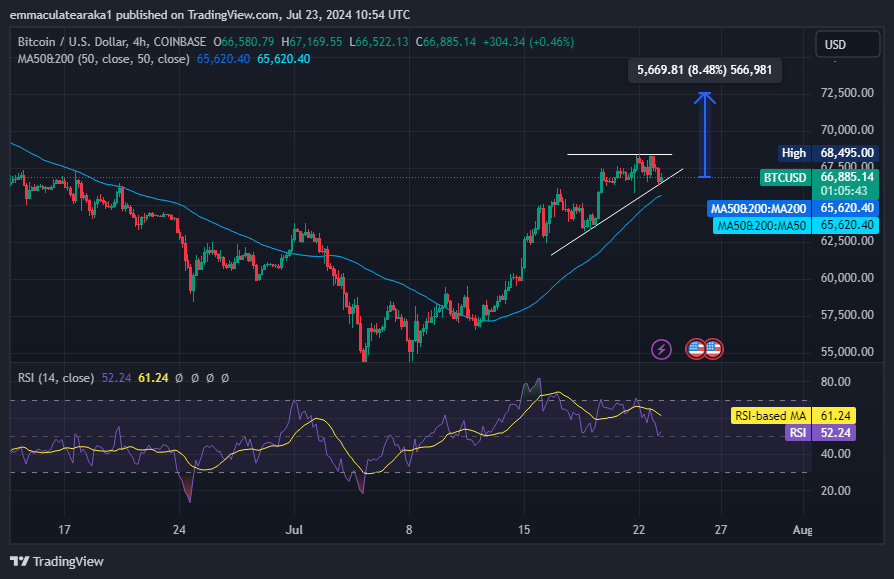
Meanwhile, an ascending pattern indicates buyers are more aggressive than sellers and are determined to keep pushing the price higher even as they face resistance at the $68,495 mark. The BTC price trades well above the 50-day and 200-day Simple Moving Averages (SMAs). In this case, the $65,620 offers strong support from the BTC bulls to increase the price.
In the same way, the Relative Strength Index(RSI) confirms the bullish outlook, with its strength at 52. This suggests that the buyers have the upper hand, and increased buying appetite could see the RSI jump to the overbought zone (70).
BTC Bulls Poised to Rally Above $68,495 Resistance Level
In the 4-hour chart analysis, the BTC bulls are poised for a rally that could see the Bitcoin price break above the critical barrier. If the bulls exert some buying pressure on the token, the BTC price could rally to around $72,500 in a few days. Conversely, if the bears step in and the Bitcoin market turns negative, the BTC price could plunge, retesting the $65,620 support level.
Advertisement


