Bitcoin Price Outlook: BTC Could Rally Upto 68K in September According to Analyst


The Bitcoin price is up almost 1% in the past 24 hours, with BTC/USD trading at $58,392. Its 24-hour trading volume has surged 77% to $29.07 billion, suggesting intense market activity among traders and investors. Meanwhile, historical data suggests that September often proves to be a red month for Bitcoin returns and the crypto ecosystem.
However, not all forecasts predict the worst. The $60,000 range remains a viable short-term target for BTC bulls. Notably, CryptoFaibik, a well-known crypto analyst, stated that “If Bitcoin bounces back from the 54k Support, it could Rally up to 68k in September.” This could be epic, but the bulls must maintain their strength and defend the $54,000 level.
Advertisement

$BTC is still Moving within a Bullish flag Pattern.
It may test the 54k Support Area again, and it's crucial for the Bulls to defend this level.
If Bitcoin bounces back from the 54k Support, it could Rally up to 68k in September.#Crypto #Bitcoin #BTC pic.twitter.com/uDToFmPCUb
— Captain Faibik 🐺 (@CryptoFaibik) September 2, 2024
Bitcoin Statistical Data
Based on CoinmarketCap data:
- BTC price now – $58, 392
- BTC market cap – $1.15 trillion
- BTC total supply – 19.75 million
- BTC circulating supply – 19.75 million
- BTC ranking – #1
Bitcoin Price Battles Resistance at $60,088 Level
The Bitcoin price trades within the confines of a falling wedge, currently at $58,392. The pioneering cryptocurrency is up almost 1% in the past 24 hours, with a trading volume of $28.78 billion. Despite the recent dip, Bitcoin remains the top cryptocurrency with a market capitalization of $1.15 trillion.
On the technical front, Bitcoin is navigating within a falling wedge channel, as depicted on the 4-hour chart. The price is currently battling resistance near the $60,088 level, which aligns with the 200-day Simple Moving Average (SMA). This resistance is crucial to watch in the market. If Bitcoin fails to break above $60,088, it could encounter increased selling pressure, potentially driving the price lower.
Moreover, the BTC price trades are below the major technical indicators, including the 50-day and 200-day Simple Moving Averages (SMAs). In this case, the bulls must first pull down the $60,088 and $60,350 before a potential leg up.
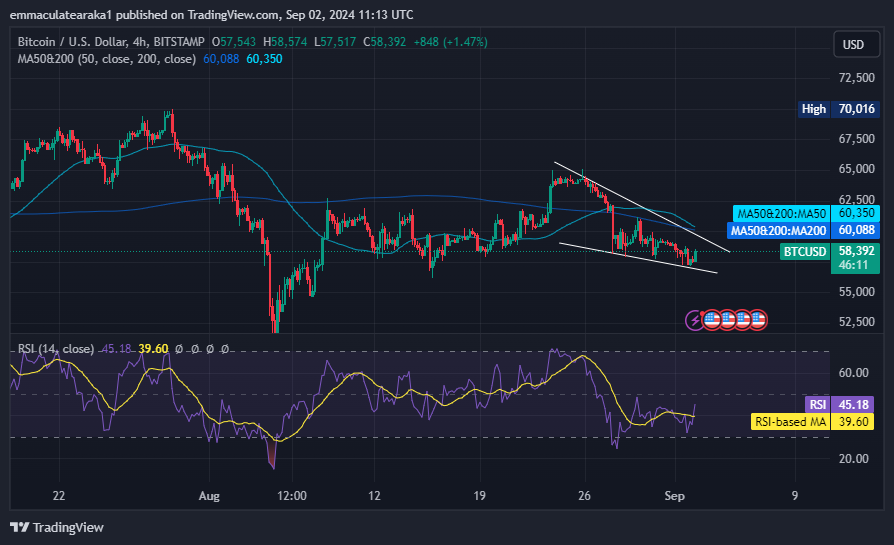
The Relative Strength Index (RSI) hovers around 45.18, signaling a bearish momentum without reaching oversold conditions. However, if investors commence adding to their positions at this level, the BTC price could soar soon.
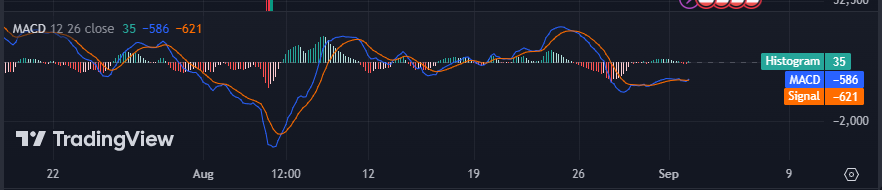
The Moving Average Convergence Divergence (MACD) upholds a bullish outlook in the Bitcoin market. This is evident as the MACD indicator (blue) has crossed above the signal line (orange), shifting the momentum from bearish to bullish. Furthermore, traders and investors are inclined to buy more BTC, with the MACD reinforcing a buy signal.
Bitcoin Price Outlook
In the 4-hour chart above, the Bitcoin bulls are showing momentum, looking forward to overthrowing the bears. If the bulls capitalize on the MACD and the rising RSI, the BTC price could surge above the critical resistance. If the pioneering crypto (Bitcoin) manages to break and close above the $60,088 resistance, it could signal the end of the current downtrend. This could shift the momentum to bullish, with the buyers eyeing the next resistance level at $60,350.
On the flip side, if the bears capitalize on the 50-day and 200-day SMAs which suggest bearish sentient, BTC could plunge. If BTC’s price continues to face resistance at $60,088, the market may witness a pullback towards the $57,143 support level, a key area that has previously acted as a cushion against further downside. A breach and break below the $57,143, may trigger panic selling, causing BTC to dive to $54,000.
Advertisement


Emmaculate Araka
Emmaculate Araka is a cryptocurrency writer with published works on Crypto2Community and other news sources. She is believer in the transformative power of crypto and the blockchain industry, conducting on-chain analysis, breaking down market-triggering events, and helping traders and investors benefit from expert technical price analysis. Emmaculate finds gratification in diving deep into the crypto space, earning herself significant knowledge and experience. She holds a Bsc. in Information Science, and outside work, Emmaculate loves reading novels and watching documentaries.
View full profile ›ℹ️About Crypto2Community's Editorial Process
Crypto2Community's editorial policy is centered on delivering thoroughly researched, accurate, and unbiased content. We uphold strict editorial policy and sourcing standards, and each page undergoes diligent review by our team of top crypto industry experts and seasoned editors. This process ensures the integrity, relevance, and value of our content for our readers.