


The Bitcoin price has surged 4% in the last 24 hours to trade at $62,277 as of 6 a.m. EST on a 17% surge in trading volume to $44 billion. Now, the market capitalization stands at $1.2 trillion. According to well-known cryptocurrency trader Josh Olszewicz, Bitcoin has moved back above the daily Ichimoku cloud, which is a positive sign for the bulls.
Advertisement
We are once again back above the daily Cloud, although we still have a bearish Cloud and bearish TK cross.
Additionally, the previous three Kumo breakouts this year have gone no where. So although this is a certainly more bullish picture than a few days ago, Cloud does… pic.twitter.com/bmlqKM9g6c
— #333kByJuly2025 (@CarpeNoctom) September 19, 2024

However, the cloud is still in bearish territory, and the Tenkan-Kijun lines suggest the possibility of further downside. Olszewicz also pointed out that previous Kumo breakouts earlier this year did not lead to sustained upward movement. The “Kumo” refers to the cloud formed between Span A and Span B.
“While the current picture is more bullish than it was a few days ago, the Cloud does not yet confirm a bullish continuation. For that, we would need a bullish Cloud along with a Bullish TK cross,” Olszewicz commented recently.
Bitcoin is currently on pace to close September in the green. The trader highlighted that Bitcoin has only managed a “green close” in September three times before, in 2015, 2016, and 2023.
Bitcoin Statistics
- Bitcoin price: $62,277
- Market Capitalization: $1.4 trillion
- Trading Volume: $44 billion
- Circulating Supply: 19.7 million
- Total Supply: 21 million
Bitcoin Price Surges Above the Bearish Channel
The daily Bitcoin (BTC/USDT) chart from Binance shows several important technical patterns and indicators that suggest a shift in momentum. Bitcoin is currently trading at $62,512, with the 50-day moving average positioned at $63,978, slightly above the current price, indicating potential resistance. Meanwhile, the 200-day moving average at $59,215 lies below the current price, offering strong support.
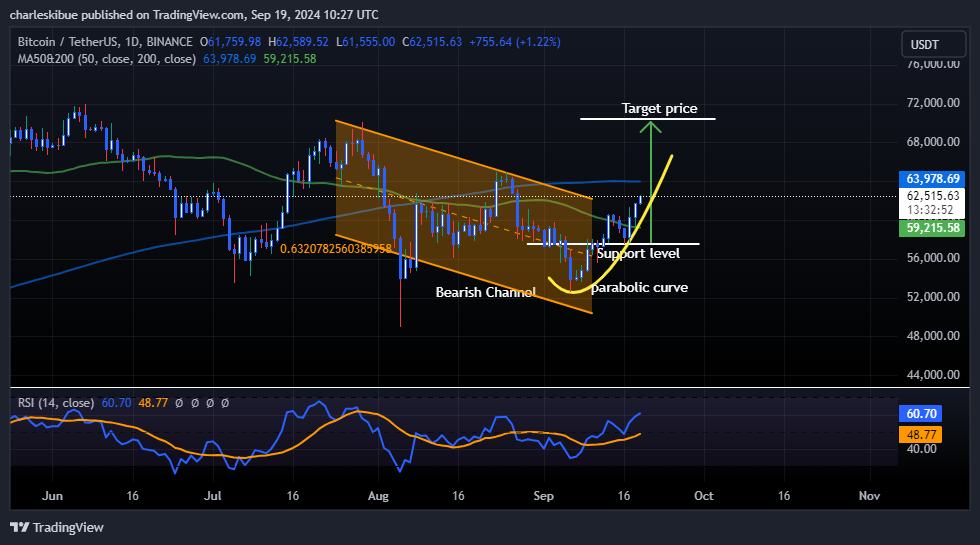
A key feature of the chart is the bearish channel that Bitcoin had been trading in, with prices dropping from $70,000 to around $56,000. However, Bitcoin recently broke out of this descending channel, signaling a possible end to the downtrend. This breakout occurred near a critical support level of around $56,000, which also aligns with the 0.618 Fibonacci retracement level. Known as the “Golden Ratio,” this level often acts as strong support in an uptrend, and the bounce off this zone suggests renewed bullish strength.
Bitcoin Poised for a Potential Rally Toward $72,000
Additionally, a parabolic curve can be observed starting from the support level at $56,000, indicating the potential for a steep upward move. This curve reflects strong upward momentum, with a target price near $72,000, as suggested by the green arrow on the chart. This parabolic rise is further supported by the recent shift in momentum.
The RSI (Relative Strength Index) is currently at 60.69, reflecting bullish momentum, but it is not yet in overbought territory. The RSI previously dipped to 48.77, which coincided with Bitcoin’s breakout from the bearish channel, further confirming the reversal from bearish to bullish sentiment.
The breakout from the bearish channel, along with the strong support at the $56,000 level and the emergence of a parabolic curve, suggests that Bitcoin is poised for further gains. The 50-day moving average at $63,978.67 could act as short-term resistance, while the 200-day moving average at $59,215.53 provides support, giving Bitcoin a favorable setup for a potential rally towards $72,000.
Advertisement


