


Highlights:
- Bitcoin price is currently trading between the $68,267 resistance and $65,877 support
- Consolidation is an indicator of a wait-and-see approach by investors
- A Trump win could trigger a rally to $100k in the coming weeks
Bitcoin shows little movement today. At the time of going to press, Bitcoin was trading at $66,359, down by 0.91% intra-day. However, volumes have taken a dip in the day, down by 25.95% to stand at $28.42 billion in the day.
Advertisement

This is an indicator that investors expect Bitcoin to remain inactive for the remainder of the day. Quite expected considering that there is little happening in the financial markets today, and more specifically in the cryptocurrency market.
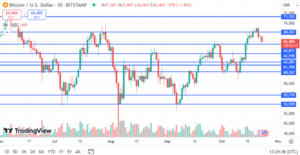
Technical Analysis – Bitcoin Price Range Bound as Volumes Drop
That said, a look at the charts offers a clearer picture of how Bitcoin could trade once volatility returns to the market. From the 1-day chart, it is clear that Bitcoin is in a short-term correction. This is after failing at the $68,267 resistance, which would have paved the way for a rally to $70k, had it been successfully breached.
With failure at the $68,267 triggering a correction, the key level to watch for Bitcoin is the $65,877 support. If bears push Bitcoin through the $65,877 support, then a correction to $63k and below could follow.
On the other hand, if bulls gain momentum and Bitcoin bounces off the $65,877 support, two scenarios could follow. The first is a possible price consolidation between the $68,267 resistance and the $65,877 support.
This could go on until there is a real trigger for a Bitcoin breakout in either direction. The second is a sudden surge in buying volumes, which could see Bitcoin price rally through the $68,267 resistance in the short term. Such a scenario could see Bitcoin rally to $70k or higher in a few long candles.
US Elections Only a Few Weeks Away
Of these scenarios, the odds are higher that Bitcoin could consolidate between the $68,267 resistance and the $65,877 support in the foreseeable future. That’s because at this point there are triggers that could see Bitcoin turn either strongly bullish or bearish at this point.
The odds are higher that Bitcoin investors will wait on the sidelines until the US elections in early November, which are only a few weeks away. There is strong optimism that if Trump wins the election, it could trigger a parabolic price run that could see Bitcoin rally to $100k or higher.
Trump now leads with 28.3% to win the US elections 🇺🇸
Kamala is done, trump already won.
He will kickstart the biggest #bitcoin bullrun we’ve ever seen.
Be positioned accordingly. pic.twitter.com/3pqZ9I9gcb
— Crypto Beast (@cryptobeastreal) October 22, 2024
On the other hand, if Kamala wins, there could be a correction before the market finds its footing again. How Bitcoin responds to a Kamala win will depend on the stance she takes on crypto. If she goes the Italian route of increasing taxes on Bitcoin, then bears may be short-lived.
That’s because there is precedence to it. Italy announced a hike in Bitcoin taxes on October 16, and Bitcoin rallied, hitting a high of $69k a few days later. However, since these events are weeks away, it makes the case for the low market activity, and the potential for a continuation of the consolidation.
Bitcoin Long-Term Chart Mirrors 2017 Chart
Another case for a continuation of the consolidation before a potential breakout is the Bitcoin longer timeframe charts. Longer-term charts indicate that Bitcoin’s price is in line with the chart pattern it displayed in the 2017 crypto cycle. This means the low level of activity could continue before a parabolic price breakout in November before a full-blown price rally in December going into 2025.
#Bitcoin 4 year cycle is still on track and is exactly where it is supposed to be.. pic.twitter.com/IyivmXGVM2
— Mags (@thescalpingpro) October 23, 2024
Recap – The Calm Is Likely to Continue
Overall, it is clear that while Bitcoin price inaction may appear boring to some investors, it is likely to continue. This could go on until the US election, where a Trump win could trigger a parabolic price run to $100k or even much higher.
Advertisement


