


The Bitcoin price has slumped by 13.3% in the last 24 hours, now trading at $52,595 as of 4:02 a.m. EST on a 359% trading volume surge to $102 billion. The leading cryptocurrency could fall further due to global economic uncertainty that has erased over $570 billion in digital asset value since August. Bitfinex analysts suggest that if bullish momentum doesn’t return, Bitcoin might test its support levels after falling below $50,000.
With the recent downturn, Bitcoin’s dominance has risen to 60%, meaning it now makes up most of the cryptocurrency market and is the main driver in the space. As a result, further declines in Bitcoin’s price could lead to broader drops across the entire cryptocurrency ecosystem.
Advertisement

Technical analysis doesn't lie. I mentioned it would drop to 48k, and we captured a 30% drop. Congratulations to those who heeded my warnings and took precautions to avoid losses. Also, congratulations to those who opened short positions and profited. #BTC #USDTD pic.twitter.com/Vm8GcR63LO
— GrayWolf6 (@graywolf6_eth) August 5, 2024
Bitfinex analysts pointed out that the recent drop was driven by macroeconomic factors rather than on-chain or technical issues. “The crash was mainly, if not entirely, due to broader economic factors,” they explained. “It was sparked by the Bank of Japan’s carry trade crisis, a disappointing US employment report, and an increase in unemployment.”
Bitcoin Price Statistics
- Bitcoin price: $52,595
- Market cap: $1.5 billion
- Trading volume: $102billion
- Circulating supply: 19.7 million
- Total supply: 21 million
Bitcoin Price Bears Continue Adding Pressure
Bitcoin has been sharply declining, with bears driving the price to the lower boundary of the bullish pennant. The downward trend appears likely to continue as bears show no signs of relinquishing control. They have demonstrated their strength by breaking through the $54,330.21 support level. This situation suggests a high probability of ongoing bearish momentum.
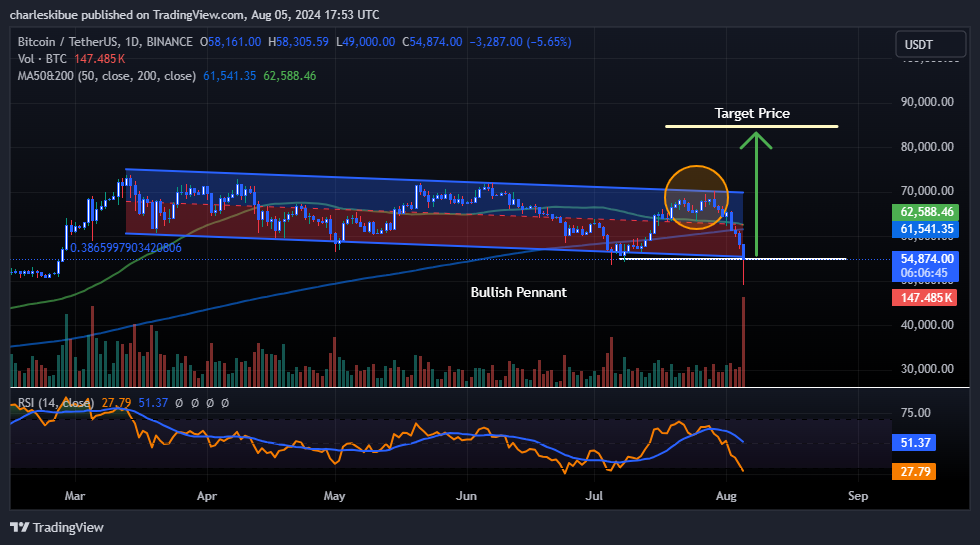
Technical analysis shows a strong bearish trend for Bitcoin, as the price is below both the 50-day and 200-day simple moving averages (SMAs), indicating that bears are in control. If this trend continues, the gap between the price and the SMAs could widen significantly, benefiting sellers. Technical indicators suggest that Bitcoin may keep falling, with the potential for substantial gains for those who are short.
Additionally, the relative strength index (RSI) indicates a drop below the 30 oversold level, nearing the creation of a low support zone. However, at this point, there is a chance that the bulls might regain momentum and push the market to a new high in the upcoming weeks. This may also push the RSI to surge to the 50 midline level, indicating intense buying pressure.
The MACD, on the other hand, indicates that it is trading in the oversold zone. The average moving average line also trades below the orange signal line, indicating that the selling pressure is intense. However there is a chance that the MACD could rebound to back the bulls to fly the price back up again.
Bitcoin Price Prediction
Despite the current upward trend suggesting a bullish outlook, bears have managed to retake control, lowering the price. They demonstrated their strength by breaking through the support zone and pushing the price further, with a target of $48,106. However, if the bulls regain momentum and push the price up, they could aim for a target of $70,215 in the upcoming weeks, which would benefit buyers.
Final Thought
While Bitcoin started August 5 with significant losses, it has since recovered nearly 50%, trading above $54,500 at the moment. According to IntoTheBlock data, Bitcoin’s ability to gain strength between $47,800 and $57,800 will be key, depending on macroeconomic developments.
Advertisement


