


Highlights:
- The price of Bitcoin drops 1% to $105K, with a 0.44% decline in daily trading volume.
- OI Delta turns negative with Bitget and CME contributing significant changes.
- Short liquidations dominate with $3.11B, indicating bearish sentiment.
Over the last 24 hours, Bitcoin’s price has decreased by 1% to $ 105,047, and its trading volume has decreased by 0.44%. In the meantime, the Open Interest Delta of the Bitcoin market has turned red after 180 days. The biggest contributors to this drop in OI have been larger exchanges, including Bitget, which reduced by 7.42 billion, and CME, which rose by 3.93 billion. The open interest in Gate.io, however, went by 3.2 billion, which is the opposite direction of the action of market makers in that exchange.
Advertisement

🚨180-Day Open Interest Delta Turns Red: What’s Next for Bitcoin?
Over the last 6 months, we’ve seen more leveraged positions closed than opened — the 180-day Open Interest Delta has gone negative.
🔻 Biggest contributors to this reduction:
Bitget: -$7.42B
CME: -$3.93B🔺 On… pic.twitter.com/Z3pZmlEEny
— Alphractal (@Alphractal) June 18, 2025
The OI Delta readers provide valuable insights to Bitcoin traders, as they track the swings in open interest on both sides of the positions. Negative OI Delta has shown a relationship to local bottoms in the price of Bitcoin in the past (2023 and 2024). The times when this figure has fallen to below zero have been signs that either a bear market was dying out or a price rally was underway. Still, there can be exceptions, as it happened in 2022 when the negative OI Delta also reached the bottom mark of the bear market.
Technical Indicators Show More Pain Ahead for BTC
Based on the daily chart outlook, Bitcoin price is oscillating between the $104 and $107 marks, within a consolidating channel. The bulls, on the other hand, haven’t lost their grip, as they have put their best feet forward, with immediate support zones at $104276 and $95,833. This may call for more upside bolstered by rising volume.
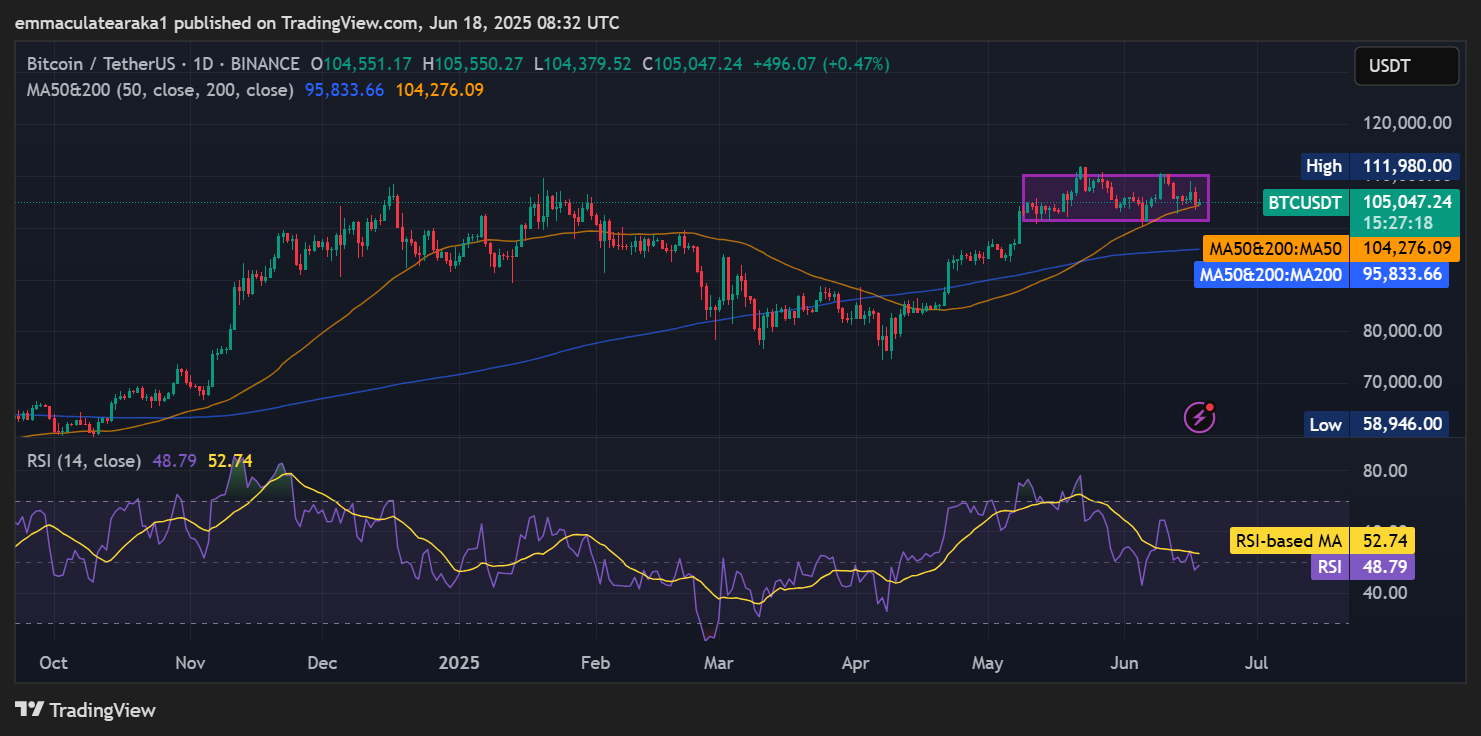
The Relative Strength Index is flirting around 48.79, indicating some bearish prospects. Meanwhile, the king coin is flirting around the equilibrium zone, in which traders should be cautious of a breakout in either direction.
In addition, the Coinglass Liquidation Map shows that there are more cumulative short liquidation leverage ($3.11 billion) compared to longs ($2.61 billion) in the last 24 hours. This imbalance suggests that bearish sentiment currently dominates the BTC market, as traders anticipate a further price drop in the future.
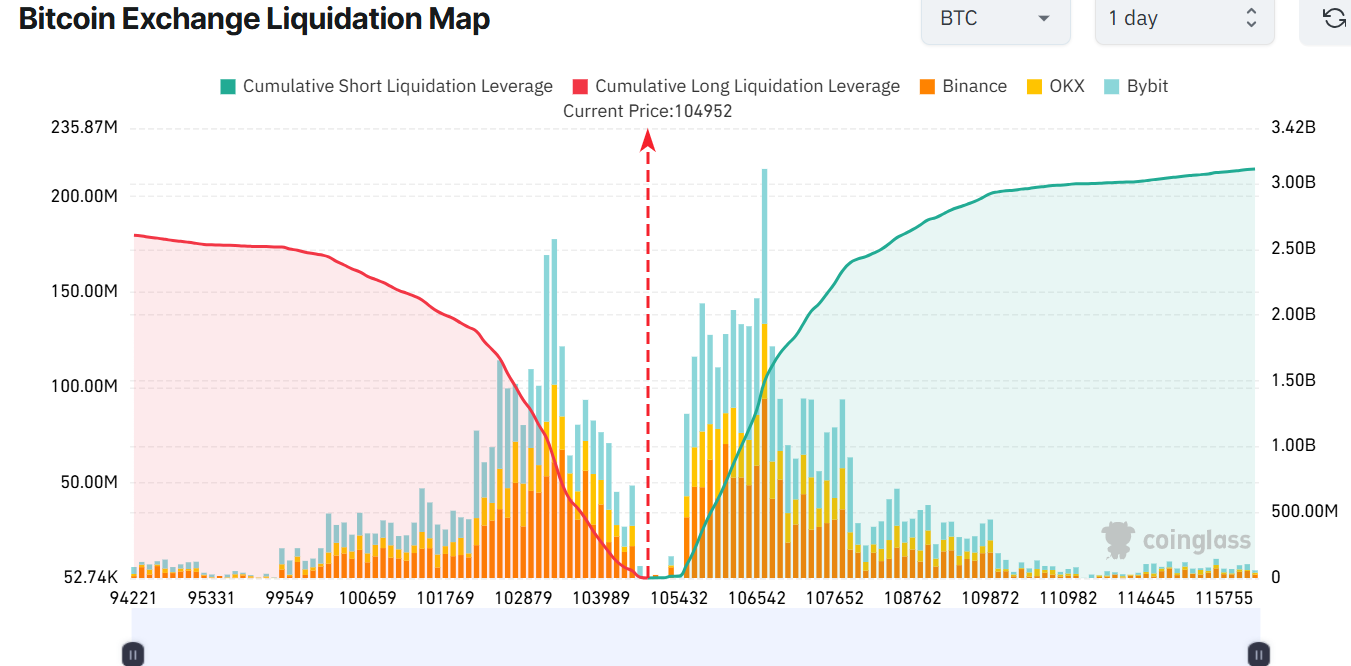
A deeper analysis of the liquidation map also shows that the $102,000 to $106,000 zone is a key consolidation level for BTC. This suggests that, despite a bearish outlook from the chart and technical indicators, the Bitcoin price may survive and remain above the $104,276 key support level.
Bitcoin Price Attempts to Find Direction
In the meantime, if the support zones hold, Bitcoin price could rise towards the $107K mark in the short term. If the surging trading volume bolsters, traders could eye the $109 mark. On the flip side, technical indicators like the RSI are still lingering below the 50-mean level. This indicates some bearish signs, and the Bitcoin liquidation map further tilts the odds in favour of the bears. In such a case, a drop below $104,276 would open the doors towards the $103, $ 102, and $101 support levels.
![]()
eToro Platform
Best Crypto Exchange
- Over 90 top cryptos to trade
- Regulated by top-tier entities
- User-friendly trading app
- 30+ million users
![]()
eToro is a multi-asset investment platform. The value of your investments may go up or down. Your capital is at risk. Don’t invest unless you’re prepared to lose all the money you invest. This is a high-risk investment, and you should not expect to be protected if something goes wrong.
Advertisement


