Bitcoin Price Builds Momentum in HODL Zone with Breakout Looming


Highlights:
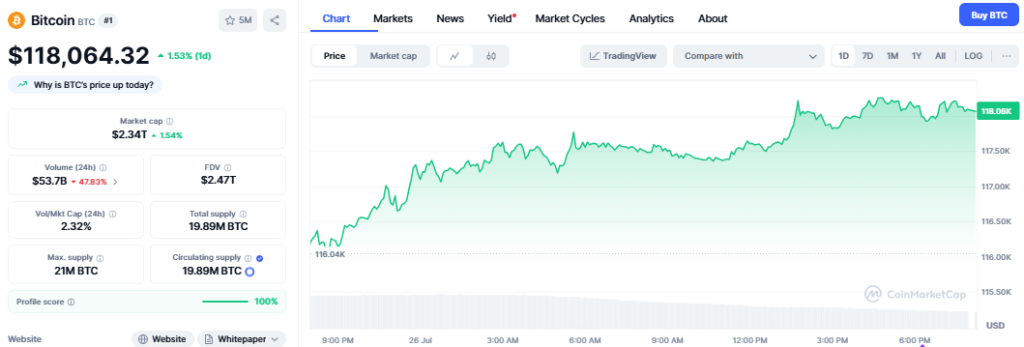
- Bitcoin price is trading around $118k, eyeing a possible breakout past the crucial $120.5k resistance.
- Crypto analyst has spotted a familiar triangle pattern, just like the setup before past Bitcoin rallies.
- Bitcoin’s market sentiment remains bullish, with the price comfortably sitting in the “HODL” range, showing investors aren’t rushing to sell.
The crypto market continues its bullish outlook today, with the global market capitalization surging by 2% to $3.88 trillion. The 24-hour trading volume has declined to $136 billion, indicating increased activity across the market. Despite the fluctuations, the fear and greed index shows a greed sentiment at 64 indexes.
Advertisement

The flagship asset, Bitcoin, has surged by 1.50% over the past 24 hours, elevating the price above the $118k mark. Bitcoin price is seeking to challenge the $120k level after a brief correction that occurred on 23rd July. This recent pullback has wiped off Bitcoin’s weekly gain despite the monthly surge of 10%. Currently, its market cap and trading volume are standing at $2.34 trillion and $53.7 billion, respectively.
Bitcoin Eyes Breakout as Price Holds Strong Pattern
Bitcoin is demonstrating stability with trading patterns reflected ten days ago. On both six-hour and daily charts, the price movements are stable, according to market analyst Rose on X. Notably, this behavior is similar to that of Bitcoin in April, when the performance dropped to a significant low. So far, there is a strong and deliberate position in the market with no apparent imminent deterioration.
Currently, Rose points out the structure of a symmetrical triangle, which can be observed both on the daily and short-term charts. The analyst are expecting this pattern to have a breakout soon. The important level of resistance to be keenly monitored by investors at approximately $120,500. Should the price break through this level, it is possible that Bitcoin would retest its all-time high.
📊 Bitcoin Technical Update – 1D & 6H Chart
Today’s price action came with moderate volume, very similar to what we saw 10 days ago — aligning closely with the April bottom execution.
✅ No signs of weakness — price is holding structure
✅ Current behavior looks healthy and… pic.twitter.com/rpaIEI6mmE
— Rose Premium Signals 🌹 (@VipRoseTr) July 26, 2025
In addition, the trading volume is moderate, which adds to the stability of the current market structure. The high level of activity indicates an orderly instead of impulsive and uncertain price movement. Consequently, a breakout above the mentioned resistance level would confirm a bullish outlook, potentially leading to further upward momentum.
Bitcoin Price Holds Strong in HODL Zone with No Sell-Off in Sight
An interesting Bitcoin trend has been recently noted by crypto analyst CryptoRand. The Bitcoin Rainbow Chart states that Bitcoin is now holding steady in the “HODL” range. This is the longest period that Bitcoin has occupied this particular valuation region without projecting its selling pressure.
The Rainbow Chart is historically useful in indicating market sentiment based on price zones, where a price can be in the range of bubble territory to fire sale. Currently, Bitcoin is steadily hovering in the middle range, indicating stable investor confidence. Notably, the market shows no immediate indications of shifting towards a sell-off scenario.
This is the longest period that #Bitcoin has ever been in the HODL zone and showing no signs of suggesting a sell off yet.
Up season continues! ✌️ pic.twitter.com/U3UsYPYh7A
— Crypto Rand (@crypto_rand) July 26, 2025
Looking back at the previous cycles, long consolidations in the area of HODL were usually followed by a strong breakout. The chart also shows previous events of halving, and these include moves between buying and selling territories. Investors usually observe these trends as a way of predicting the next market movement of Bitcoin.
Technical Analysis: BTC Price Correction Imminent?
After a strong upward move, Bitcoin’s price is struggling to hold above the $120k mark. The price shows signs of stalling near its ATH level. Currently, key support sits around $117k, and if broken, $114k could be next in line.
In addition, the Relative Strength Index (RSI) has slipped from recent highs, now hovering around 60. This shift signals weakening buying pressure. If it continues lower, momentum could favor the bears, leading to a short-term pullback.
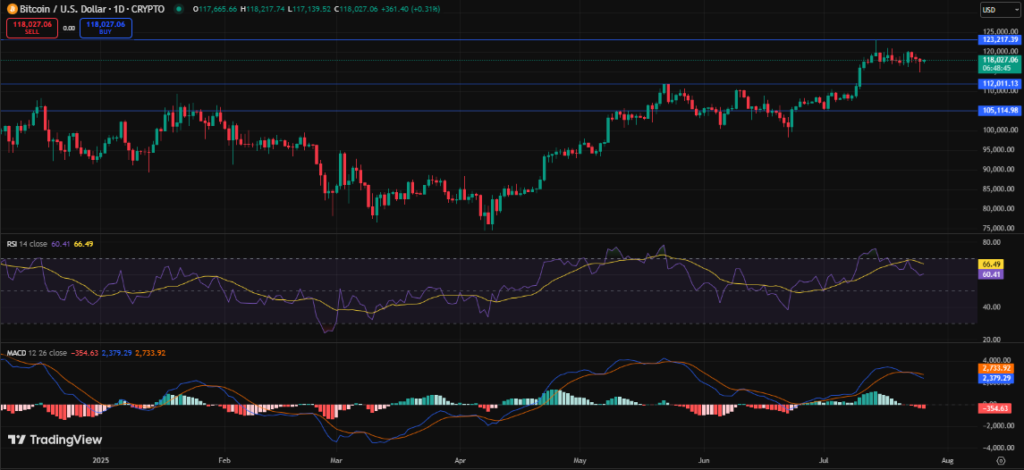
Meanwhile, the Moving Average Convergence Divergence (MACD) shows a bearish crossover. The histogram has turned red, suggesting a cooling trend. If volume stays low, price could drift down further. However, a bounce from support might reverse any deeper correction.
![]()
eToro Platform
Best Crypto Exchange
- Over 90 top cryptos to trade
- Regulated by top-tier entities
- User-friendly trading app
- 30+ million users
![]()
eToro is a multi-asset investment platform. The value of your investments may go up or down. Your capital is at risk. Don’t invest unless you’re prepared to lose all the money you invest. This is a high-risk investment, and you should not expect to be protected if something goes wrong.
Advertisement


Raymond Munene
Raymond Munene is a crypto content writer who contributes to Crypto2Community. With over three years of experience, he is interested in Bitcoin, Blockchain, and Technical Analysis. Focusing on daily market analysis, his research helps traders and investors alike. His particular interest in cryptocurrency and blockchain aids his audience.
View full profile ›ℹ️About Crypto2Community's Editorial Process
Crypto2Community's editorial policy is centered on delivering thoroughly researched, accurate, and unbiased content. We uphold strict editorial policy and sourcing standards, and each page undergoes diligent review by our team of top crypto industry experts and seasoned editors. This process ensures the integrity, relevance, and value of our content for our readers.