


The Bitcoin price has exited the red zone today, soaring by 2%, with BTC/USD exchanging hands at $58,045. Its 24-hour trading volume has surged 13% to $36 million, signaling a rise in market activity.
This comes as the widely watched inflation gauge showed that U.S. consumer prices rose less than expected through August. According to the Bureau of Labor Statistics (BLS) report on Sep 11, the Consumer Price Index (CPI) fell to a 2.5% annual increase, slightly below the expected 2.6%. However, the core inflation, which excludes food and energy, rose 0.3% monthly, surpassing expectations of 0.2%.
Advertisement

🚨 JUST IN: US CPI inflation comes in at 2.5% YoY.
Expectation: 2.6% pic.twitter.com/3ynmTgsNrw
— Josh (@CryptoWorldJosh) September 11, 2024
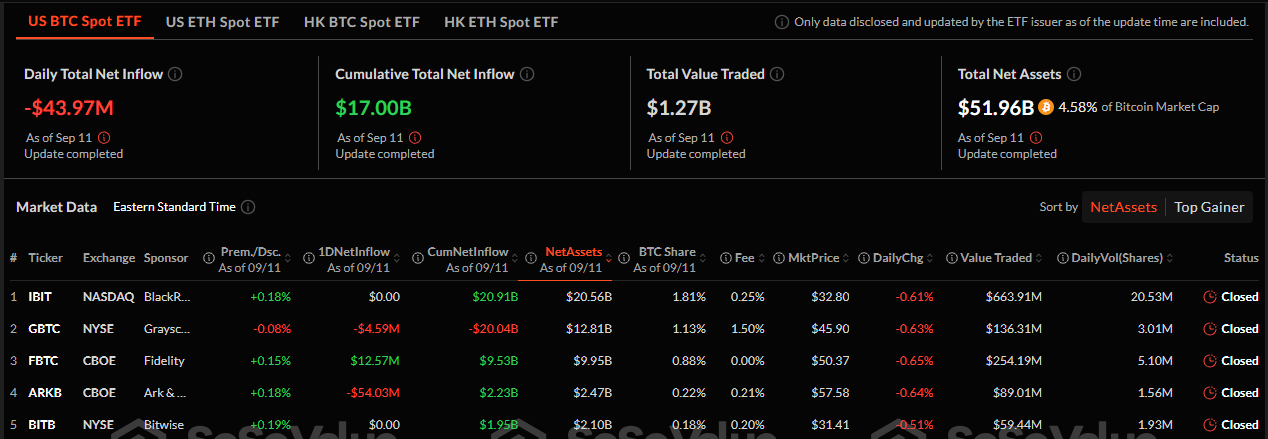
On the other hand, Bitcoin spot ETFs have experienced outflows. On September 11, investors made a net total of $43.97 million worth of withdrawals from the funds. ARKB took the lead with $54 million in outflows. Data from SoSo Value indicates that Grayscale’s (GBTC) Bitcoin ETF reported an outflow of $4.59 million, while Fidelity’s (FBTC) ETF showed an inflow of $12.57 million.
Meanwhile, Moon, a well-known crypto analyst and investor, is optimistic that history will repeat itself in the Bitcoin market. He has noted that “The last time BTC pumped 200% after 200+ days of consolidation was in March – October 2023.”
History may repeat itself soon! The last time #BTC pumped 200% after 200+ days of consolidation in March – October 2023 🚀 pic.twitter.com/q4GObZFHsz
— The Moon (@TheMoonCarl) September 12, 2024
Bitcoin Statistical Data
Based on CoinmarketCap data:
- BTC price now – $58,045
- Trading volume – $36 billion
- Market cap – $1.14 trillion
- Total supply – 19 million
- Circulating supply – 19 million
- BTC ranking – #1
Bitcoin Price Surpasses $58K, What’s Next?
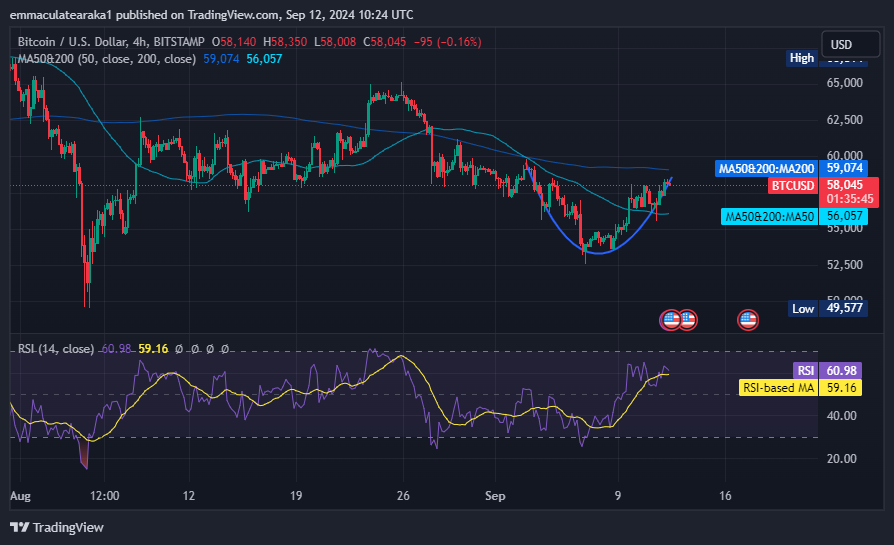
The pioneering cryptocurrency (Bitcoin) shows upward momentum after conquering the $57,500 technical barrier. This positive outlook serves as a positive signal to most market participants, suggesting a shift in sentiment soon. The Bitcoin price has formed a rounding bottom pattern, which could ignite an upswing to the $60,000 mark in the short term.
Meanwhile, the Bulls have broken above the 50-day Simple Moving Average (SMA). This is evident as the buyers have flipped the $56,057 resistance zone into support, signaling that the buyers have gained some control in the short term. Furthermore, the bulls are eyeing the next resistance at $59,074, which coincides with the 200-day SMA, cushioning them against upward movement.
Based on the Relative Strength Index (RSI) upholds a bullish picture, tilting the odds in favor of the buyers. It sits above the 50-mean level, currently at 60, suggesting increased buying pressure. Its position below 70 indicates significant room to the upside before BTC is considered overbought.
The Moving Average Convergence Divergence (MACD) indicator upholds the bullish picture with a buy signal, calling for traders to rally behind BTC. This calls investors to consider buying BTC, which is manifested with the MACD line in blue, crossing above the orange signal line. As the momentum indicator gradually ascends above the mean line (0.00) into the positive region, the path with the least resistance stays on the upside.
Will BTC Reclaim the $60,000 Mark?
From the 4-hour chart above, the BTC price could surge if the bulls sustain the momentum. Investor confidence in the altcoin has improved significantly over the last few days, especially with support at $56,057 holding steady. The most recent rebound pushed BTC above the technical barrier at $57,500. However, to be safe, bulls must uphold higher support at $59,074 to encourage already sidelined investors to join the uptrend without worrying about sudden corrections.
The BTC price could reclaim the $60,000 mark in such a case. Conversely, a breach and break below $57,500 will cause a drop in the BTC price. This could lead to short-term downward pressure; however, the $56,057 will act as a cushion against further losses.
Advertisement


