


Highlights:
- Bitcoin and Ethereum ETFs have registered inflows as the latest flow data emerged.
- BTC ETFs concluded the week with profits, while ETH ETFs ended with losses.
- Bitcoin and Ethereum prices have seen remarkable upswings, with the possibilities of imminent breakouts.
Bitcoin (BTC) and Ethereum (ETH) Exchange Traded Funds (ETFs) have recorded inflows on the last trading day of the week. Spotonchain tracking outlet tracked the flow, which it reported on its verified X handle. According to the on-chain tracker, Bitcoin ETFs welcomed $92 million in net inflows. On the other hand, its Ethereum counterpart saw only $2.9 million in gains.
Advertisement

Following the latest flow data, Bitcoin ETFs concluded the week with net inflows of about $397 million, having registered gains in four out of five open market days. Conversely, Ethereum ETFs saw profits in two out of five outings. Therefore, they ended the week with approximately $26.2 million in losses.
🇺🇸 Spot ETF: 🟢$92M to $BTC and 🟢$2.9M to $ETH
🗓️ Sep 20, 2024👉 The total flow for BTC ETFs this week is +$397M, with inflows on 4 out of 5 trading days.
👉 The total flow for ETH ETFs this week is -$26.2M, with inflows on 2 out of 5 trading days.
Follow @spotonchain and… pic.twitter.com/Ay2NyFphhI
— Spot On Chain (@spotonchain) September 21, 2024
FBTC Leads Inflows For Bitcoin ETFs
Bitcoin ETFs saw heightened activities with inflows from seven out of eleven commodities. The remaining four entities, including Franklin Bitcoin ETF (EZBC), BkackRock Bitcoin ETF (IBIT), WisdomTree Bitcoin ETF (BTCW), and Grayscale Bitcoin ETF (GBTC) all had zero flows.
For inflows, Fidelity Bitcoin ETF (FBTC) and ARK 21Shares Bitcoin ETF (ARKB) saw the highest positive flows, with about $26.1 million and $22 million, respectively. Meanwhile, Bitwise Bitcoin ETF (BITB), Grayscale Mini Bitcoin ETF (BTC), and VanEck Bitcoin ETF (HODL) followed closely. They ranked third, fourth, and fifth, with roughly $15.1 million, $13.4 million, and $7.1 million, respectively.
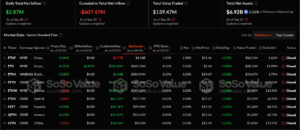
BTC’s ETFs latest flow data implies that the cumulative net inflow increased slightly to about $17.69 billion. Meanwhile, the total value traded was approximately $980.5 million, while total net assets reflected $57.47 billion. The total net assets valuation represents about 4.63% of Bitcoin’s market cap.

Ethereum ETFs Record Inflows From Only One Commodity
Unlike Bitcoin, Ethereum ETFs recorded minute activities as only one commodity recorded net inflows. Grayscale Mini Ethereum ETF (ETH) welcomed the only net profits with $2.9 million, while the remaining eight ETFs registered zero flows.
Because of its poor ETF trends, its cumulative netflow has continued to wallow losses at about $607.47 million. The total value traded reflected $139.47 million, while total net assets read approximately $6.92 billion. Notably, the total net assets value represented 2.26% of Ethereum’s market capitalization.
Bitcoin Targets $65,000 with Remarkable Market Actions
At the time of writing, Bitcoin is changing hands at approximately $63,100, despite a subtle 0.6% decline from the previous day. In just one week, BTC registered price upswings of about 5.3%, with minimum and maximum prices ranging between $57,767.78 – $63,938.07. The price extremes signify remarkable expansion with the possibility of an imminent breakout.
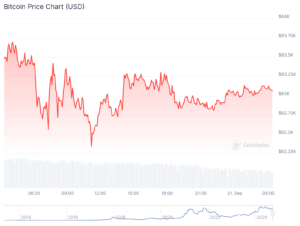
Notably, in its 14-day-to-date and month-to-date price change data, BTC saw increments of approximately 16.2% and 3.6%, respectively. Other relevant statistics revealed that Bitcoin’s trading volume is down by about 38.74% with a $25.77 billion valuation.
Ethereum Reclaims $2,500 and Could Head Towards $3,000
Like Bitcoin, Ethereum has been displaying remarkable price actions. The world’s number one altcoin has a selling price of approximately $2,550, mirroring a 0.4% upswing in the past 24 hours.
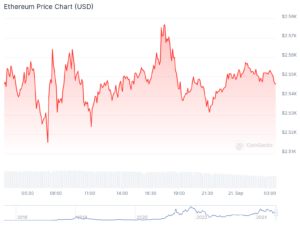
In its 1-day-to-date and 7-day-to-date price change variables, ETH recorded increments of about 5.6% and 11.2%, respectively. Notably the price extremes within the 1-day-to-date and 7-day-to-date statistics were $2,515.84 – $2,576.93 and $2,267.98 – $2,564.31, respectively. Therefore, it highlights the possibility of ETH stabilizing around the $2,500 region, which invariably implies that a break towards $3,000 is imminent.
$ETH Chart Update
Next Target: $5500-$6000
Best Accumulation Zone: $2500-$2100
Long Term Target: $8000-$10,000#Ethereum bounced strongly from the $2100 level (channel support), and with the next resistance at $5500-$6000, I’m expecting the next stop for #ETH to be $6000 pic.twitter.com/eLOa5pIrIN— Crypto Patel (@CryptoPatel) September 21, 2024
Advertisement


