


Highlights:
- Avalanche price has risen 4% to $14, as its daily trading volume soars 7%.
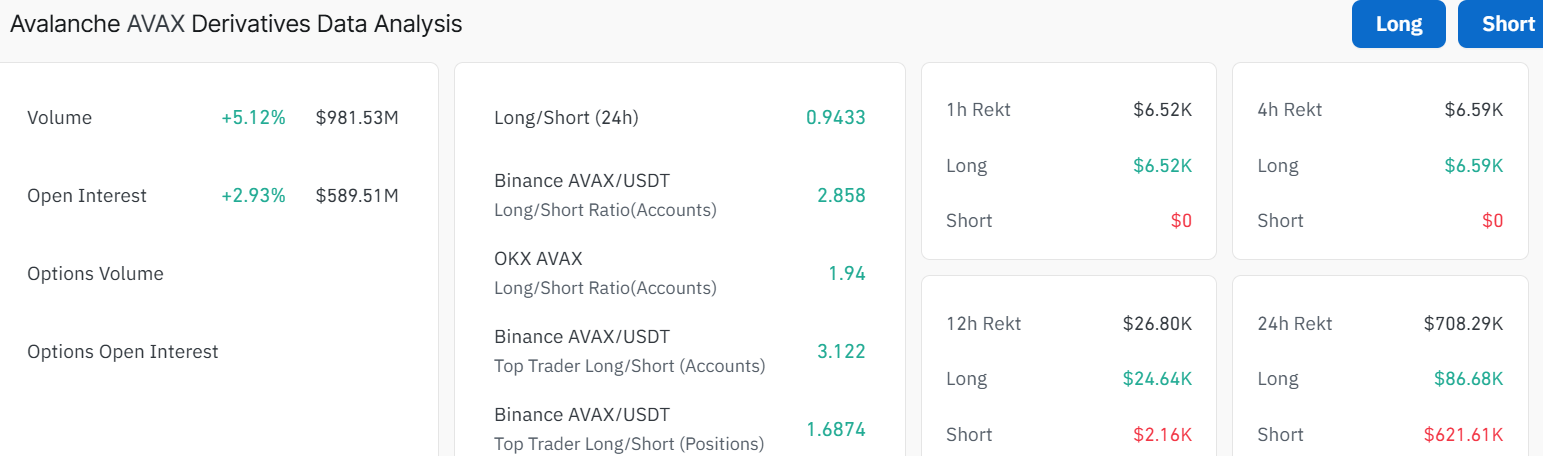
- The derivatives market shows a positive outlook as the OI spikes 2%.
- The AVAX technical outlook shows a potential breakout towards $16 soon.
The Avalanche (AVAX) price is having a break above $14.00, marking a 4% rise in the past 24 hours, following two days of recovery. Nevertheless, the general risk-off mood among buyers is represented by a very sideways movement in AVAX futures Open Interest (OI). Meanwhile, the AVAX technical outlook points to a turn of momentum with a breakout of a resistance trendline.
Advertisement

Retail interest in Avalanche is yet to recover following the crash on October 10 that plunged AVAX futures Open Interest (OI) to $645.54 million, as compared to $1.45 billion. AVAX OI is currently at $589.51 million, higher than it was on the previous day, $562.17 million. This indicates a wait-and-see stance among investors, despite the 2% spike. The volume has notably soared $981.53 million, suggesting growing trading activity.
Nonetheless, the upcoming Bitwise Avalanche Exchange Traded Fund (ETF) may raise the demand for AVAX in case the US Securities and Exchange Commission (SEC) approves it.
Avalanche Price Poised for a Breakout above the Falling Channel
The daily chart for AVAX/USD is attempting further upside, with the price eyeing a breakout above the falling parallel channel. However, the bulls have an uphill battle in the market, as the bears have established a major barrier at the 50-day SMA ($16.79) and the 200-day SMA($21.99).
The Avalanche price has, however, rebounded from the recent lows at $12 to test the upper trendline of the falling pattern at $14.This move shows that traders are paying attention, and additional momentum may see a major breakout towards $16 resistance.
Looking at indicators, the Relative Strength Index (RSI) at 46.64 is slightly below the neutral territory. However, it is pointing upward, showing that there is still room to climb before it is considered overbought.
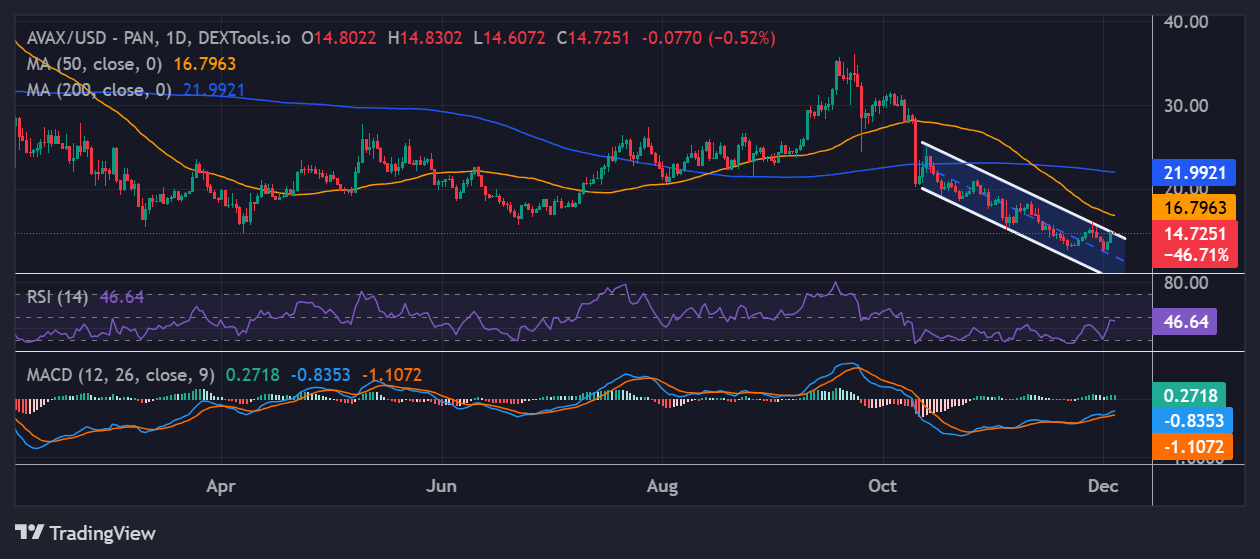
The Moving Average Convergence Divergence (MACD) shows a bullish crossover, with the MACD line (blue) edging above the signal line. This combination signals mixed momentum, which may result in an extended upside movement as bulls are accumulating the AVAX tokens.
The $16 level (50-day SMA) is a strong floor, with $21 (200-day SMA) serving as the ultimate long-term barrier. If the bulls keep pumping the price, resistance at $16 could flip to support, opening the door to $21 or beyond.
Conversely, if the resistance zones prove too strong, the Avalanche price may retest the $12 support area. AVAX trading volume has, however, risen 7%, which is a good sign as it shows traders are active in the market. In the short term, Avalanche’s 4% climb and chart action suggest a bullish trend. If the bulls exert pressure at current price levels, reinforced by the bullish technical indicators, the Avalanche price could climb to $16 resistance level. In the long term, it’s all about holding key levels and global adoption for AVAX.
![]()
eToro Platform
Best Crypto Exchange
- Over 90 top cryptos to trade
- Regulated by top-tier entities
- User-friendly trading app
- 30+ million users
![]()
eToro is a multi-asset investment platform. The value of your investments may go up or down. Your capital is at risk. Don’t invest unless you’re prepared to lose all the money you invest. This is a high-risk investment, and you should not expect to be protected if something goes wrong.
Advertisement


