Aave Price Surges 10% to Hit a 3-Year High as Bulls Eye the $400 Target

Cryptocurrency trading is speculative and your capital is at risk when you trade. We may earn affiliate commissions from some of the products on this page - at no extra cost to you.

Highlights:
- AAVE is trading at $353, marking a 10% gain in the past 24 hours, with a 62% increase in trading volume.
- The market cap exceeded $5 billion, with AAVE reaching a 3-year high of $395 on December 17.
- AAVE Poised to Test $400 Resistance Amid Positive Market Trends.

Aave just soared to its highest price in three years! After a solid 12 months of TVL, fees, and revenue growth on @aave, this surge shows how on-chain data can really hint at big moves ahead.#AAVE #Crypto #DeFi #OnChainMetrics #Growth pic.twitter.com/j7c0LHYYUZ
— Crypto_Joker (@Crypto_Joker_US) December 22, 2024
On-chain metrics have greatly improved AAVE’s performance. According to DeFiLlama, its Total Value Locked(TVL) reached a year-high of $22 billion early this month but has since retraced to less than $20 billion. Fees generated on Aave have also grown significantly, indicating increasing on-chain activity.
Other catalysts that helped Aave rise in price were President-elect Trump’s friendly crypto views and investments in Aave and other cryptocurrencies by World Liberty Financial, an investment firm of the Trump family.
AAVE whales added to the frenzy, as investors are expected to hold on for more gains come the new year. Community hype is highly expected from the much-awaited Aave V4 release and the announced token buyback and burn.
Aave Statistics
- Aave price: $333
- Market Capitalization: $5.2 billion
- Trading Volume: $1.29 billion
- Circulating Supply: 15 million
- Total Supply: 16 million
Technical Analysis
The daily chart of AAVE/USDT on Binance clearly depicts a strong uptrend that has been developing since mid-November. The price currently stands at $335.44, resulting from a 5.16% increase in price within the day.
Before this rally, AAVE had consolidated within the key support area between $160 and $200 for many months. A chart will show a parabolic curve line that has propelled the price upwards, which indicates strong and increasing momentum. Parabolic trends are highly unstable, and whenever the curve is breached, usually violent corrections occur.
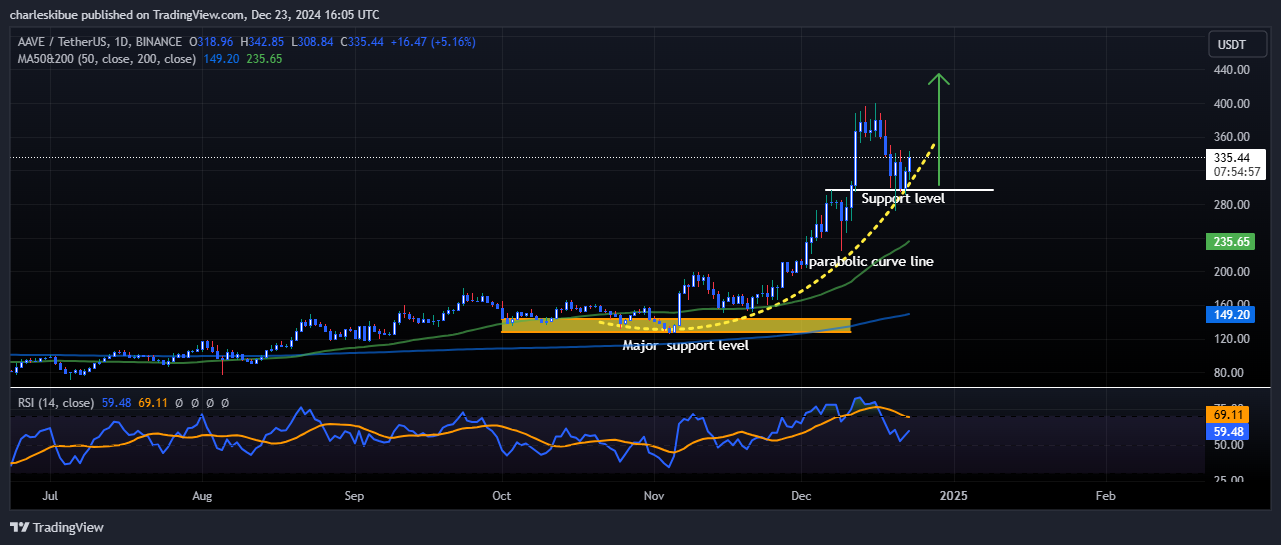
These days, AAVE reached its ATH close to $400, retraced to $280–$300, and is finding current support around the area. This pullback allowed the price to retest its support and confirm the upward trajectory.
More importantly, the MA functions confirm how strong this current trend is. The 50-day MA stood at $235.65, and the 200-day MA was at $149.20, both well beneath the level where the price stands in the present scenario. The large separation between the moving averages indicates a strong bullish setup wherein the 50-day MA will act as the first dynamic support in case of a deeper correction.
More Bullish Uptrend Ahead for Aave Price
The 14-period RSI is currently at 59.48, well below the overbought threshold of 70. This implies there is enough room for further upside until buyers get exhausted. This now sets a healthy trend, as it shows the continuity of the bullish momentum without overstretching. However, traders should know that any potential bearish divergences, for instance, when the price makes higher highs but is not followed by the RSI, may signal weakening momentum and possible reversals.
If the price can continue to stay above the support area of $280–$300 and continues to show respect for the parabolic curve, one could easily see a retest of the recent high at $400. A successful breakout above this level may lead to new all-time highs and reinforce the bullish narrative.
Conversely, a decisive break below $280 could invalidate the parabolic trend and trigger a deeper correction. In this case, a 50-day moving average at $235.65 would be an important area to watch for potential support.
![]()
eToro Platform
Best Crypto Exchange
- Over 90 top cryptos to trade
- Regulated by top-tier entities
- User-friendly trading app
- 30+ million users
![]()
eToro is a multi-asset investment platform. The value of your investments may go up or down. Your capital is at risk. Don’t invest unless you’re prepared to lose all the money you invest. This is a high-risk investment and you should not expect to be protected if something goes wrong.
Advertisement


