
Highlights:
- The Hedera price is trading at $0.1234, with crypto market sentiment favourable.
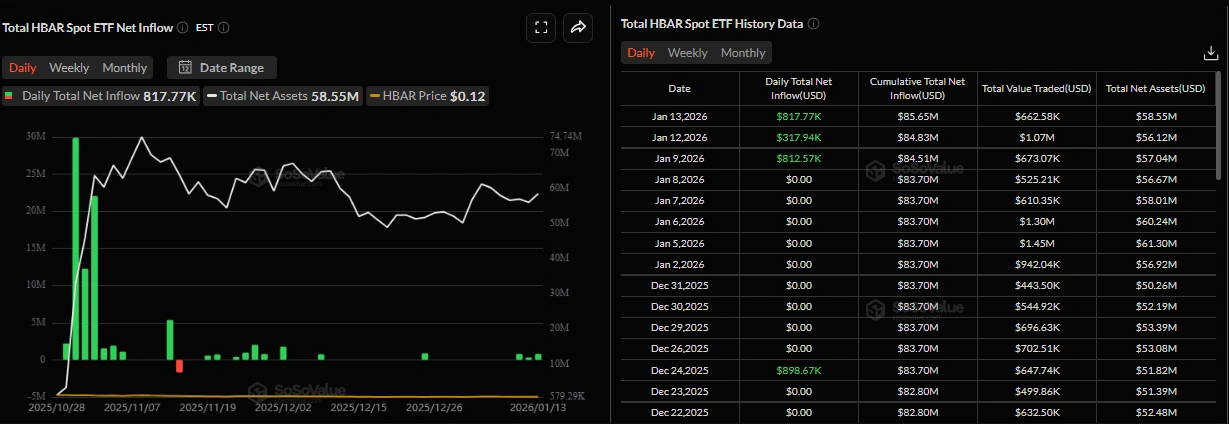
- The HBAR ETFs recorded their third consecutive day of inflows totalling $817,777, which strengthens the bullish case.
- The technical chart shows rising buying pressure, as Hedera price eyes $0.15 if the $0.1237 resistance level gives way.
Hedera price (HBAR) is trading near a major resistance level, currently at $0.1234, up 6% over the last 24 hours. Bulls are also targeting a break above the immediate resistance at $0.1237 to continue the upward move towards $0.15. Institutional demand has been high this week, with three days of spot HBAR Exchange-Traded Fund (ETF) inflows registered. It is worth noting that the positive derivative data also suggest that HBAR may not end its surge.
Advertisement

Hedera institutional demand has been rising this week. The Hedera spot ETFs, as reported by SoSoValue, saw an inflow of $817,777 on Tuesday, marking the third consecutive week of inflows. As long as these inflows continue and grow higher, HBAR can maintain its current price boom.
On the other hand, the derivatives market supports the positive outlook. According to Coinglass data, HBAR’s open interest is up 10% to $138 million, while volume is up 77% to $404 million. This latest spike added to the increased trading action, with new capital entering the HBAR market. This may further drive the token upside, potentially obliterating the immediate at $0.15 resistance soon.
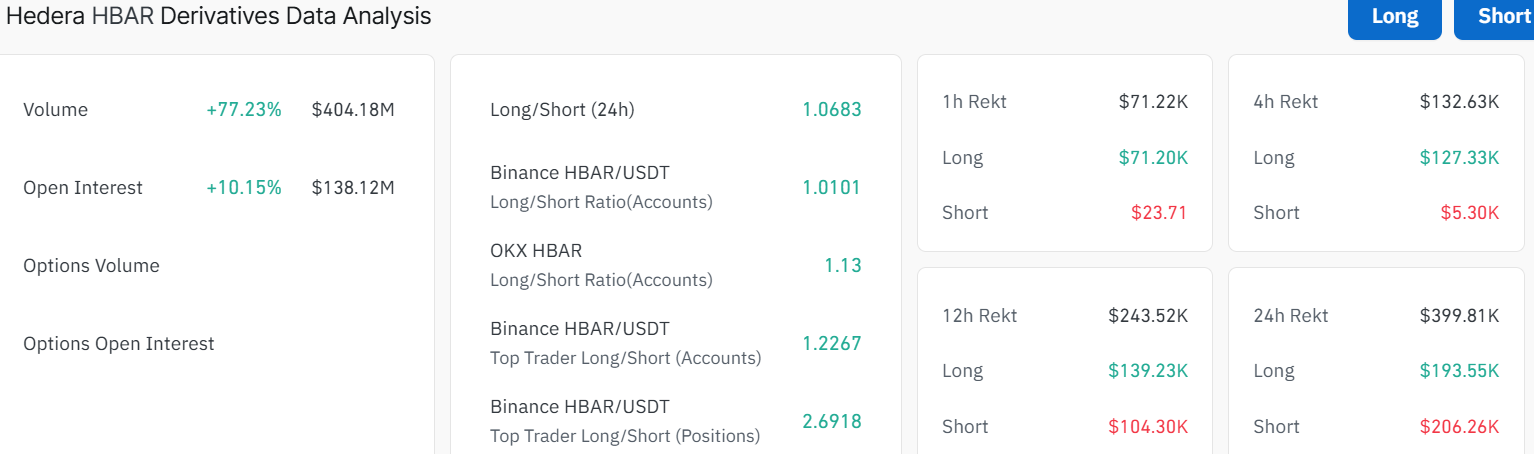
Notably, the long/short ratio for HBAR on Coinglass was 1.06 on Wednesday, the highest since the end of last month. This ratio is above 1, indicating a bullish market and more traders bullish on Hedera’s price rising.
Hedera Price Eyes $0.15 If Key Resistance Gives Way
The Hedera chart is bullish and points to a breakout above the major resistance level at $0.1237. The 50-day Simple Moving Average (SMA) is at $0.1237, slightly above the current price of $0.1234, and serves as a resistance level.
Diving into momentum indicators, the RSI shows a reading of 53.02, which is neutral and favours upward movement. This indicates there is still room before the HBAR token becomes overbought. The MACD shows a bullish crossover, as the MACD line (blue) crosses above the signal line (orange). This outlook points to a bullish move, and a break over the $0.1237 resistance is expected to have room to move.
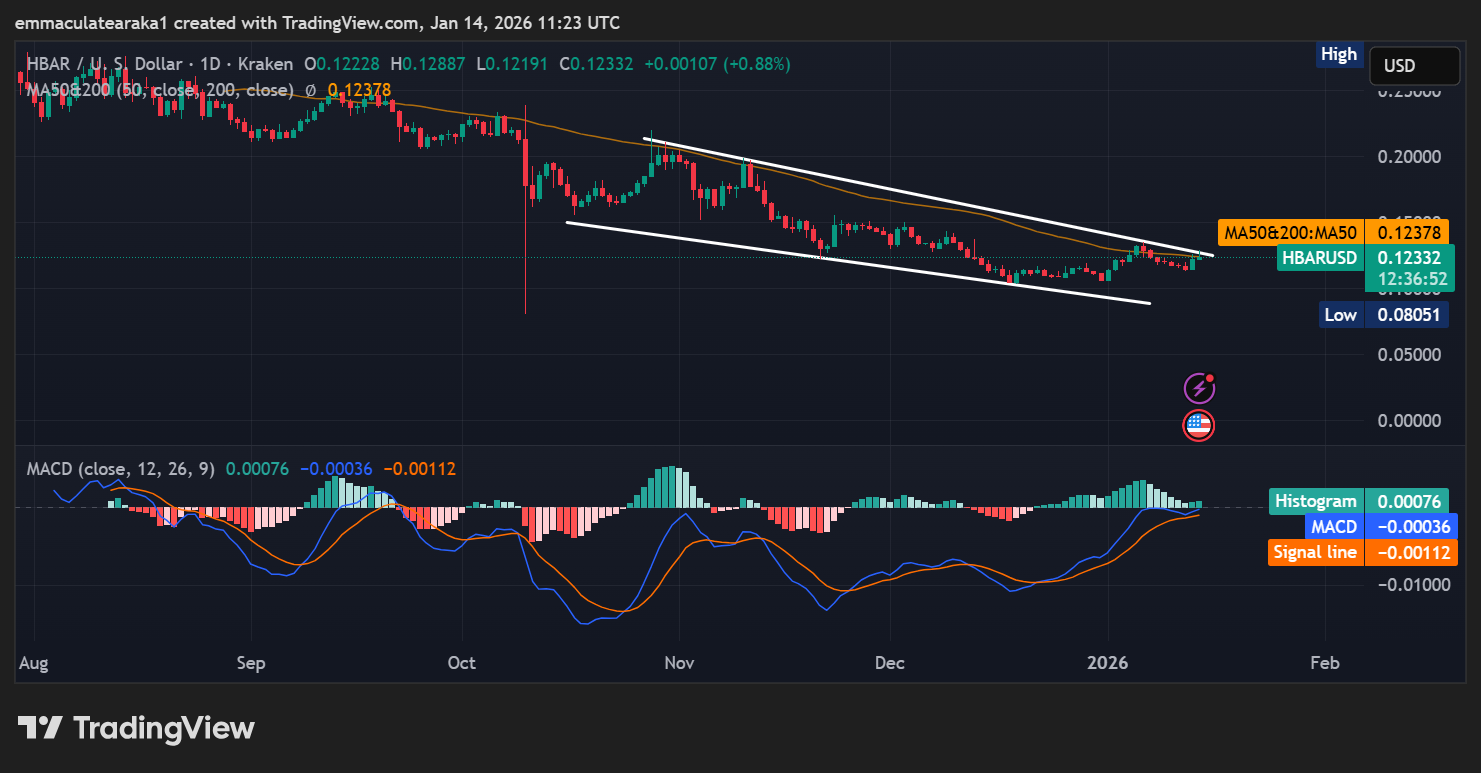
Looking at the bigger picture, if Hedera is above $0.1237 (50-day SMA), the next resistance may be tested at $0.15. Nevertheless, a pullback below the $0.11 short-term support may bring prices down to the low of $0.0805, seen on 10 th October 2025.
In the meantime, the 6% pump on that day aligns with positive sentiment developing in the market, as Bitcoin’s price is already above $95k. That said, it could be crypto news, whale activity, or a market dump that could alter the script. At the moment, traders should watch for a breakout above $0.1237, which could open the door to the $0.15 zone.
![]()
eToro Platform
Best Crypto Exchange
- Over 90 top cryptos to trade
- Regulated by top-tier entities
- User-friendly trading app
- 30+ million users
![]()
eToro is a multi-asset investment platform. The value of your investments may go up or down. Your capital is at risk. Don’t invest unless you’re prepared to lose all the money you invest. This is a high-risk investment, and you should not expect to be protected if something goes wrong.
Advertisement