Highlights:
- The XRP price has rebounded above $2.00, currently up 1% to $2.05.
- The XRP ETFs have recorded nearly $180 million in inflows in the past week, indicating a positive sentiment.
- The technical outlook indicates a potential rebound towards $2.39 if the $2.00 support zone remains intact.
The XRP price has reclaimed above the $2.00 level, currently trading at $2.05, marking a slight 1% surge. The cross-border payment token began trading on Monday at $ 2.05, following the growth experienced over the weekend, which had pushed it to $1.95. There is also a consistent level of demand for XRP Exchange-Traded Funds (ETFs), which indicates a positive sentiment in the XRP token. This further enhances the likelihood of XRP experiencing an uptrend towards $2.39.
Advertisement

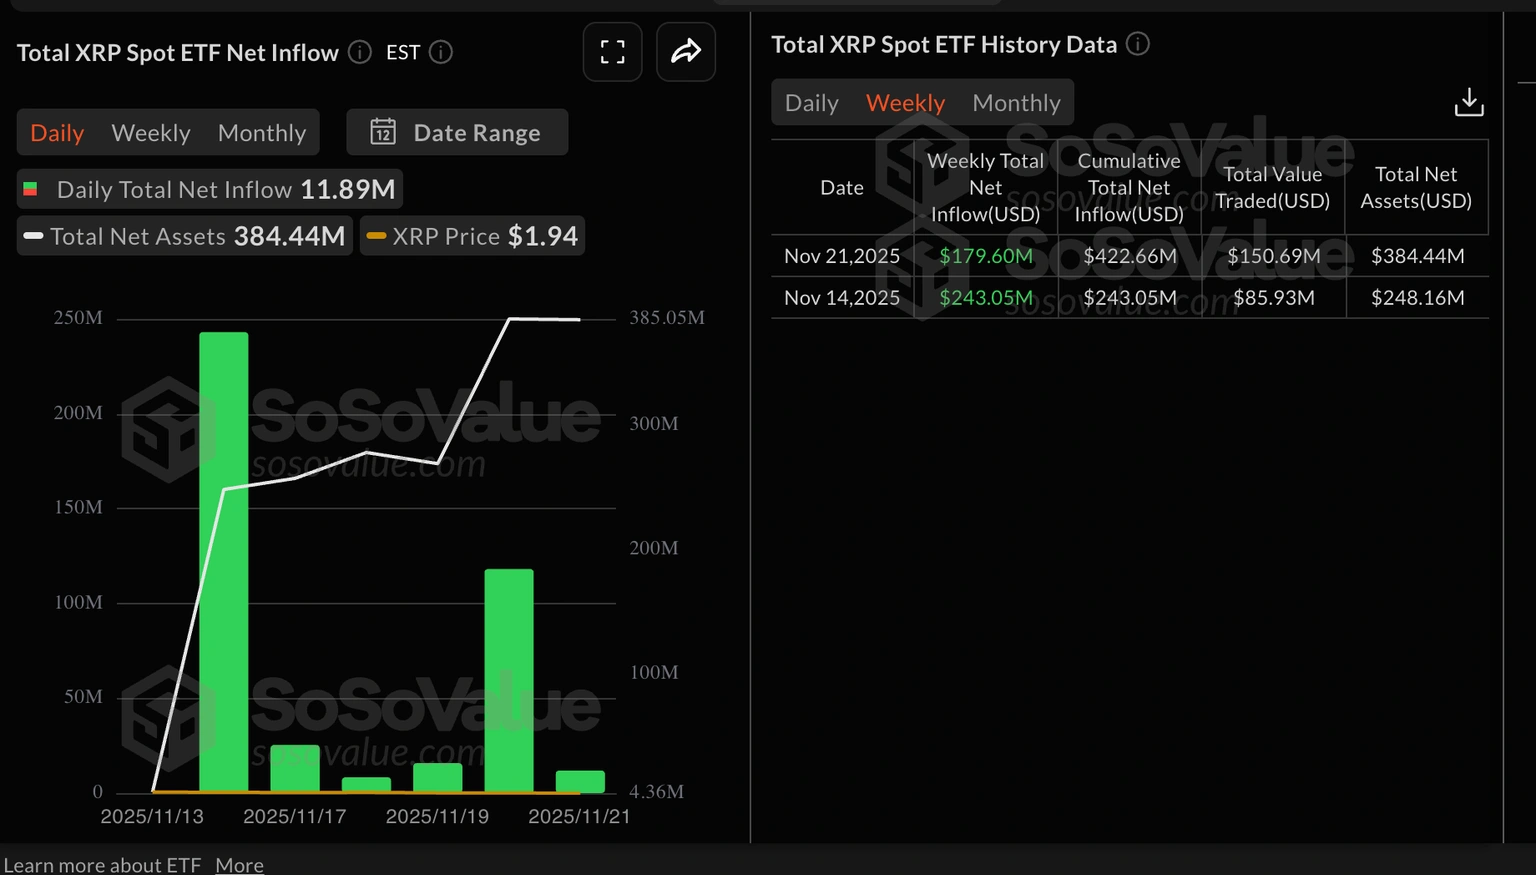
The recent bullish launch of US-listed XRP ETFs resulted in nearly $180 billion in inflows over the last week and $243 million in inflows the week before. According to SoSoValue data, crypto products have been accessed directly through the stock exchange.
A total net inflow volume of approximately $423 million and net assets of $384 million as of November 21. The XRPC ETF by Canary Capital recorded about $619,000 in net inflows on Friday, and Bitwise ETF XRP recorded the best performance at $11 million.
The continued influx of ETFs will support optimism surrounding XRP. This will potentially strengthen risk appetite and increase the likelihood of a steady rebound towards $2.39 in the short term.
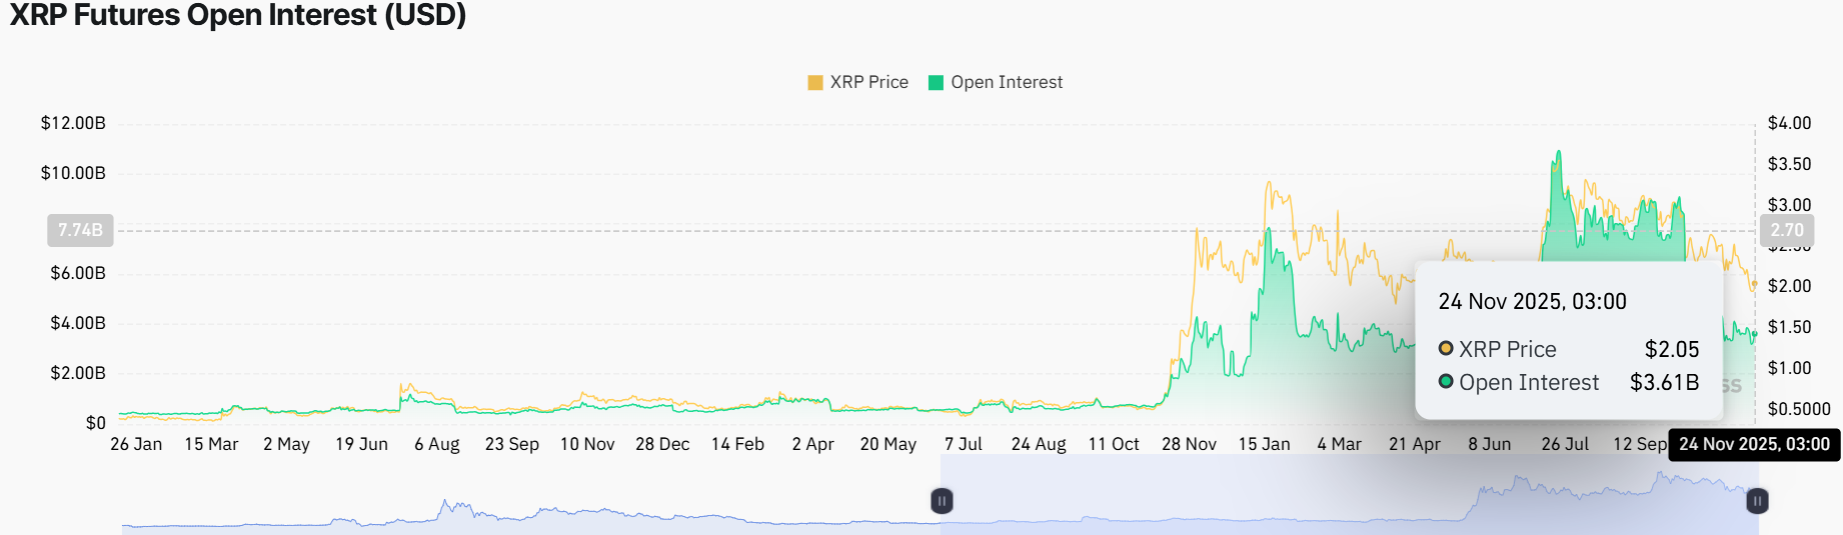
On the other hand, according to CoinGlass data, the XRP Future Open Interest (OI), which represents the amount of outstanding futures contracts in terms of notional value, stands at 3.61 billion. This is compared to $3.28 billion on the day before. OI should progressively increase to back the risk-on mood, as the investor expands its risk exposure. Meanwhile, the recent rise indicates growing interest among traders in the XRP market.
XRP Price Poised for a Rebound to $2.39 Soon
The XRP price is resting right above the $2.00 mark, as the bulls attempt a recovery above resistance zones. The key technical indicators signal caution but not panic. To start with, the RSI (Relative Strength Index) is at 39.39, showing that the coin is still navigating in the bearish territory.
The 50-day SMA (Simple Moving Average) now sits higher at $2.39, while the 200-day SMA sits at $2.62, acting as an immediate resistance zone. XRP is trading below both SMAs, indicating that the short-term trend remains uncertain.
Notably, the MACD (Moving Average Convergence Divergence) is currently negative at -0.0153, with the orange signal line slightly above the blue line. This shows that the selling pressure is still intact unless the MACD changes.
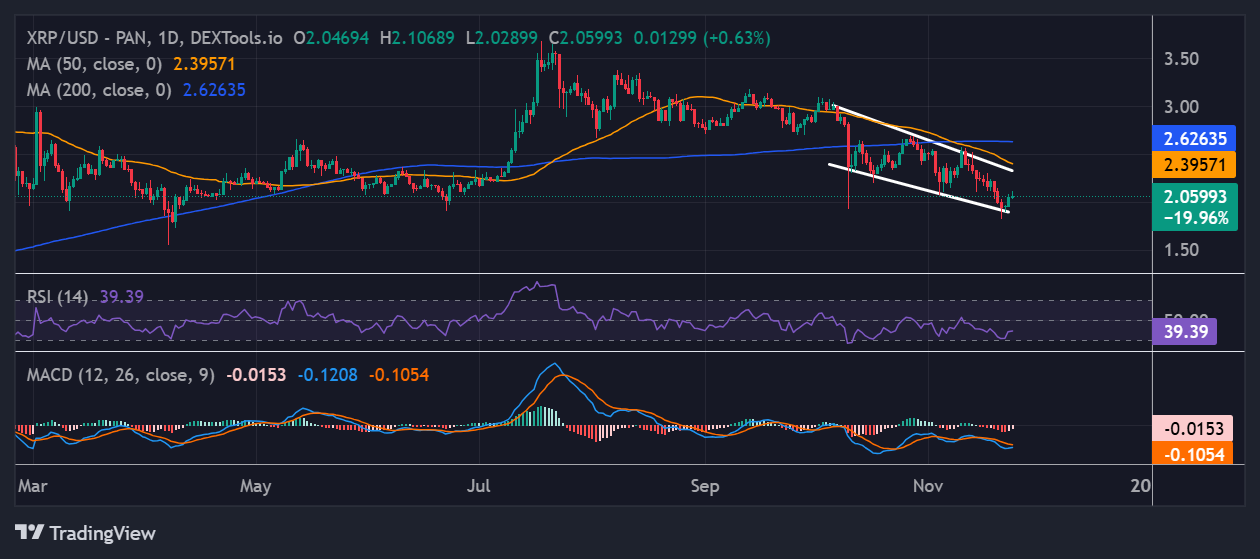
The current price action is drifting within a falling parallel channel. If buyers defend the $2.00 support, a rebound to test resistance at $2.39 is possible. A push above this resistance could open the door to $2.62 and then $3.00, if the bullish sentiment bolsters. However, if sellers take control and the XRP price loses support at $2.00, the price could drop quickly to $1.94 or even $1.80, where the next major buying zones sit.
![]()
eToro Platform
Best Crypto Exchange
- Over 90 top cryptos to trade
- Regulated by top-tier entities
- User-friendly trading app
- 30+ million users
![]()
eToro is a multi-asset investment platform. The value of your investments may go up or down. Your capital is at risk. Don’t invest unless you’re prepared to lose all the money you invest. This is a high-risk investment, and you should not expect to be protected if something goes wrong.
Advertisement