Highlights:
- The SPX6900 price has rebounded 4% to trade at $0.57.
- The growing trading volume and positive funding rate suggest potential upside in SPX.
- The technical outlook shows a fading bearish outlook, as bulls target $0.76-$0.95 in the short term.
The SPX6900 (SPX) price is trading within $0.57, up 4% in the past 24 hours. The derivatives statistics indicate that market conditions are improving, and the positive funding rates are reasons to expect the new wave of bullishness. In the meantime, technical indicators also indicate the dwindling bearish pressure, which is why a potential surge in SPX is possible.
Advertisement

The derivatives data also help in supporting a recovery rally in SPX6900. Coinglass OI-Weighted Funding Rate data indicate that traders betting on a fall in the price of SPX have fewer traders than traders betting on a price rise.
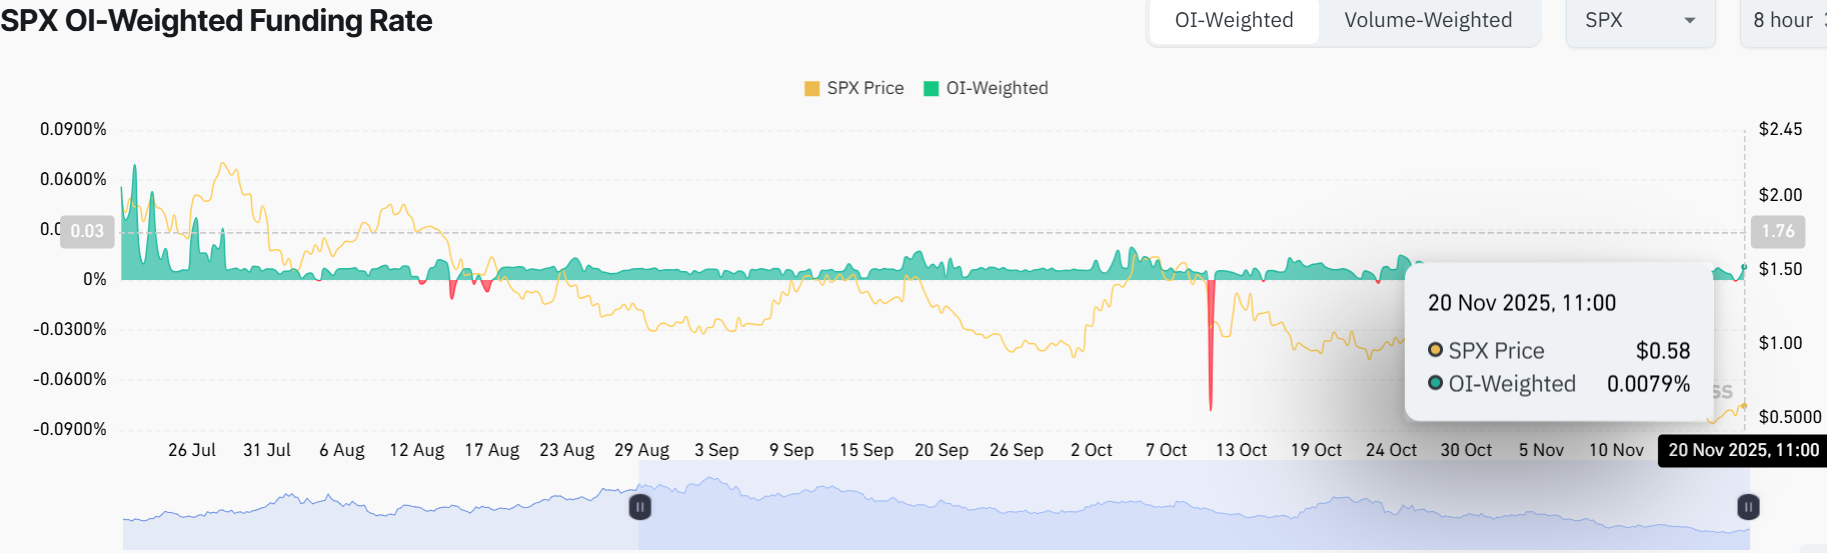
The metric has reversed to a positive rate on Thursday and stands at 0.0079% showing that the longs are paying the shorts. In the past, when the rates of funding have inverted to be positive, as indicated on the chart, the SPX6900 price surged.
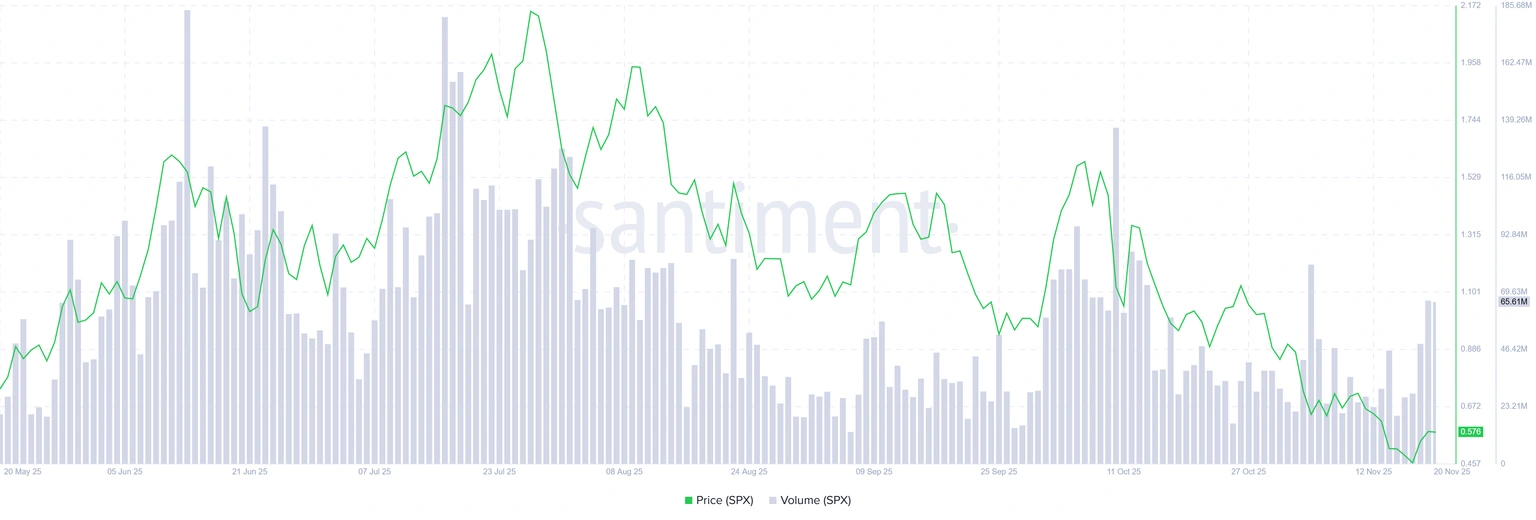
Notably, the trading volume in the SPX ecosystem, as measured by Santiment (the sum of trading volume generated by all exchange applications on the chain), is as high. It has continued to increase steadily since mid-November. This increase in volume shows a significant amount of interest and liquidity among traders in SPX6900. Moreover, this adds more bullishness to the SPX token.
SPX Price Poised for a Breakout Above the Falling Wedge
The 1-day SPX/USD chart shows that the price spiked out to $1.60 before entering a downtrend, respecting a falling wedge pattern. However, the SPX6900 price is showing strength as it has rebounded from the lows, currently at $0.57. The falling wedge pattern is a bullish reversal pattern if the price breaks out to the upside. Otherwise, it can usher the price to lower levels if bears remain persistent.
Zooming into the indicators, the Relative Strength Index (RSI) at 39.22 is below neutral, hinting that there’s room to run before the crypto hits overbought territory. Meanwhile, the Moving Average Convergence Divergence (MACD) line is exhibiting a bullish crossover as it trends above the signal line (orange).
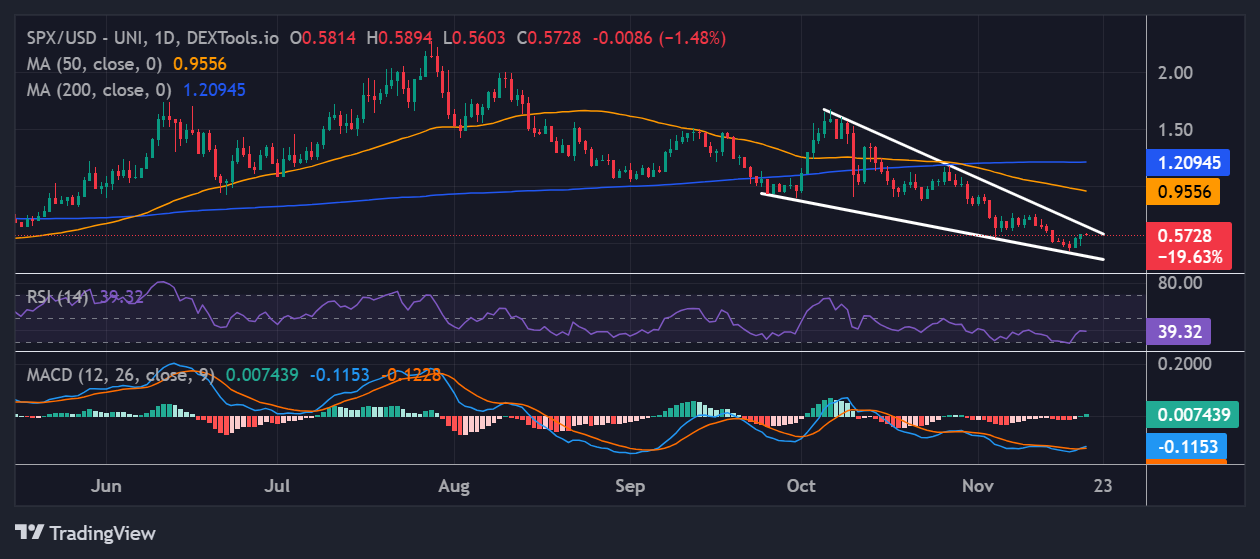
The chart’s setup shows a potential breakout, especially if the bulls regain strength. Looking ahead, in the short term, the SPX6900 price might test $0.76-$0.95 resistance zones this week if the growing optimism around the project is alive. A clean break above could ignite a run to $1.20, aligning with the upper resistance(200-day SMA) level highlighted on the chart.
Conversely, if the resistance zones prove too strong, the support around $0.45 might catch the fall. A drop below that could ignite panic mode, which could mean a deeper correction. The ‘death cross’ is also evident in the market, cautioning of a potential downside. In the short term, the SPX6900 price may go through some choppy movements. In the long term, if the market stabilizes, a rally above $1.20 could ignite a bullish rally towards $1.50.
![]()
eToro Platform
Best Crypto Exchange
- Over 90 top cryptos to trade
- Regulated by top-tier entities
- User-friendly trading app
- 30+ million users
![]()
eToro is a multi-asset investment platform. The value of your investments may go up or down. Your capital is at risk. Don’t invest unless you’re prepared to lose all the money you invest. This is a high-risk investment, and you should not expect to be protected if something goes wrong.
Advertisement