


Highlights:
- Ethereum is consolidating between $4843.8 and $4273.5
- Rally through $4843.8 resistance could trigger a rally to $5000
- Upcoming interest rate cuts in the US could trigger a rally
Ethereum (ETH), like the rest of the market, is unchanged today. At the time of going to press, Ethereum was trading at $6431.59, down by a negligible 0.78% in the day. However, trading volumes are on the rise and are up by 5.23% to stand at $31.18 billion on the day. This is an indicator that traders are unsure of where Ethereum could be going next.
Advertisement

On one hand, those who believe Ethereum could be headed for a correction are exiting their positions. On the other hand, there is growing optimism that Ethereum could be headed to new highs in the foreseeable future. A couple of factors support both sides of the trade.
Technical Indicators Point to A Potential Correction Short Term
One of the factors that is driving the Ethereum bears is the technical price setup. Many analysts believe that Ethereum price charts and technical indicators point towards it being in oversold territory. One of these metrics is the fact that the amount of Ethereum in profit has hit 99.3%. This has in the past led to price corrections and could trigger a similar price action this time around. At the same time, the taker buy-sell ratio, which measures the ratio of aggressive relative to aggressive sellers, has dropped below 0.91. This is an indicator that aggressive sellers are increasingly overpowering aggressive buyers.
🚨 Ethereum just formed a TRIPLE TOP 🚨
One of the most bearish patterns in the playbook.
⚠️ If support breaks, $ETH could drop hard 👇Can bulls save it? pic.twitter.com/MiNTF7E9os
— Soon Tzu (@soontzu) September 14, 2025
At the same time, some chart analysts have pointed to the formation of a rising wedge pattern for Ethereum. This pattern is usually bearish and, in the case of Ethereum, could be a precursor to a drop towards price levels as low as $4300 in the short term. Such a convergence of bearish indicators could see short sellers start taking positions and push Ethereum to new lows in the short term. Despite the short-term technical metrics painting a bearish picture, the growing adoption of Ethereum paints a bullish picture in the long term.
Growing Ethereum Demand From Institutions Could Drive Upside Breakout
A significant bullish indicator for Ethereum is the growing demand for Ethereum from institutional investors. Data shows that Ethereum ETFs recently attracted $405 million in inflows. At the same time, the amount of Ethereum available for trading on exchanges is shrinking. Analysts put the amount of Ethereum currently available for trading on exchanges at between 17 and 19 million Ethereum.
This is the same level of Ethereum available for trading as far back as 2016, a signal to a sharp shrinkage in reserves. The shrinking reserves mean demand is increasingly chasing a declining amount of Ethereum. Applying the economic law of supply and demand could trigger a parabolic price move for Ethereum as the price adjusts towards equilibrium.
$ETH ETFs saw $405 million in inflows yesterday.
Smart money continues to accumulate. pic.twitter.com/4X6ZGSJZY7
— Lark Davis (@TheCryptoLark) September 13, 2025
Macro Environment Favors A Bullish Breakout
At the same time, the macro environment increasingly favors an Ethereum rally. Recent data on the US economy drives a growing expectation that the Federal Reserve will soon cut interest rates. If the rate cut happens within this month, it could trigger an Ethereum rally, one that could push the price to new highs in the short to medium term.
JUST IN: 🇺🇸 Federal Reserve is set to make its first interest rate cut this year – FT
Bullish 🚀 pic.twitter.com/0FsljBgndo
— Alex $QANX || $DOT || $GLMR (@callebkristov) September 15, 2025
Technical Analysis – Ethereum Price Continues Trading In A Range
Ethereum is currently consolidating between the $4843.8 resistance and $4273.5. If bulls take control and push Ethereum through the $4843.8 resistance, then a rally to $5000 could follow in the short term.
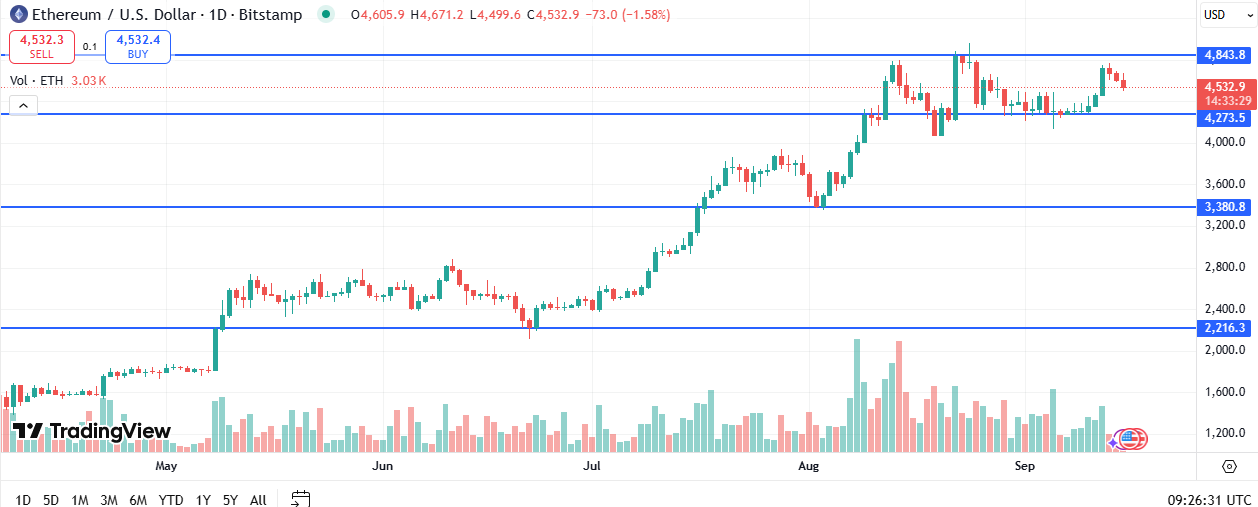
On the other hand, if bears take control and push Ethereum through the $4273.5 support, then a correction to $4000 in the short term is possible. Of these two scenarios, the odds are higher that Ethereum is likely headed to $5000. That’s because the upcoming interest rate cuts in the US could trigger a push into risk-on assets like Ethereum.
![]()
eToro Platform
Best Crypto Exchange
- Over 90 top cryptos to trade
- Regulated by top-tier entities
- User-friendly trading app
- 30+ million users
![]()
eToro is a multi-asset investment platform. The value of your investments may go up or down. Your capital is at risk. Don’t invest unless you’re prepared to lose all the money you invest. This is a high-risk investment, and you should not expect to be protected if something goes wrong.
Advertisement


