

Highlights:
- BTC price shows signs of life, as the altcoin surges 0.44% to $ 118,918, with trading volume surging 12%.
- A crypto analyst predicts that a close outside the $ 117,000 and $119,700 levels may trigger a BTC rally.
- The BTC derivatives market is showing mixed signals, as the long-to-short ratio suggests a potential upside.
The Bitcoin price is starting to show signs of life after reclaiming the $118K level, marking a 0.44% rise in the past 24 hours. Notably, its daily trading volume has soared 12% to $74.4 billion, indicating growing market activity.
Advertisement

Meanwhile, according to popular analyst Ali Martinez, the Bitcoin price is set for a massive breakout if certain resistance zones are cleared. His recent technical analysis indicates that Bitcoin is on the verge of a major turning point, as the Bollinger Bands are squeezing on the 4-hour chart. This is a rare occasion when the Bollinger Bands are squeezed, and it can portend a breakout if BTC closes outside the $117000 and the $119,700 levels.
The Bollinger Bands are squeezing on Bitcoin $BTC 4-hour chart. A volatility spike is imminent. A close outside the $117,000–$119,700 range will set the stage for the next big move. pic.twitter.com/UX0jd9Cf3I
— Ali (@ali_charts) July 24, 2025
The Bitcoin derivatives market is also giving mixed signals, which contributes to the confusion about the price of BTC. The volume has dropped by 2.29% to $92.68 billion in the past 24 hours. Notably, the open interest has decreased by 1.19% to $84.05 billion. The amounts suggest that, although trading remains very active, no one is willing to make a significant bet in either direction.
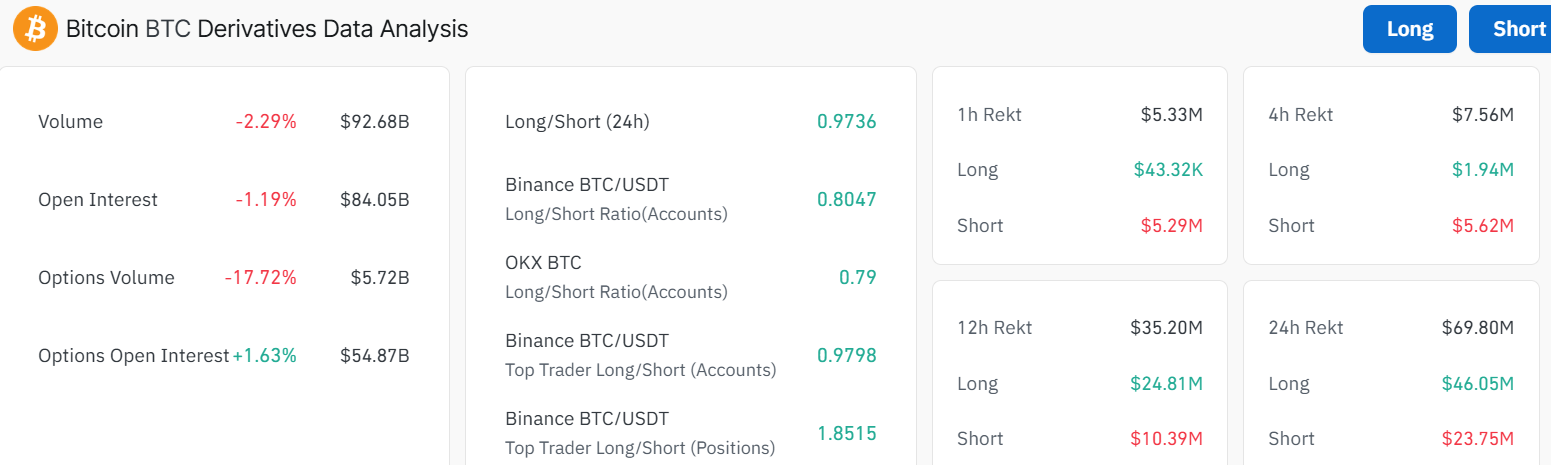
The options volume has also seen a sharp decline of 17.72%, definitely indicating a decrease in interest in leveraged positions. It may indicate that traders are awaiting a more definitive indication before taking large positions. Despite the mixed signals in the BTC derivatives market, the long-to-short ratio is 0.97. This suggests a fairly impartial view, without clearly indicating what will happen to the Bitcoin price in the short term.
BTC Price Moves Into a Consolidation Channel
The daily chart outlook indicates that BTC has entered a consolidation channel, oscillating between the $ 117,000 and $ 120,000 levels. The bulls are having the upper hand, as they have established immediate support at $98,271 and $110,111. If this zones hold, and Bitcoin price surpasses the $119,700 level, a spike towards the recent ATH could be imminent.
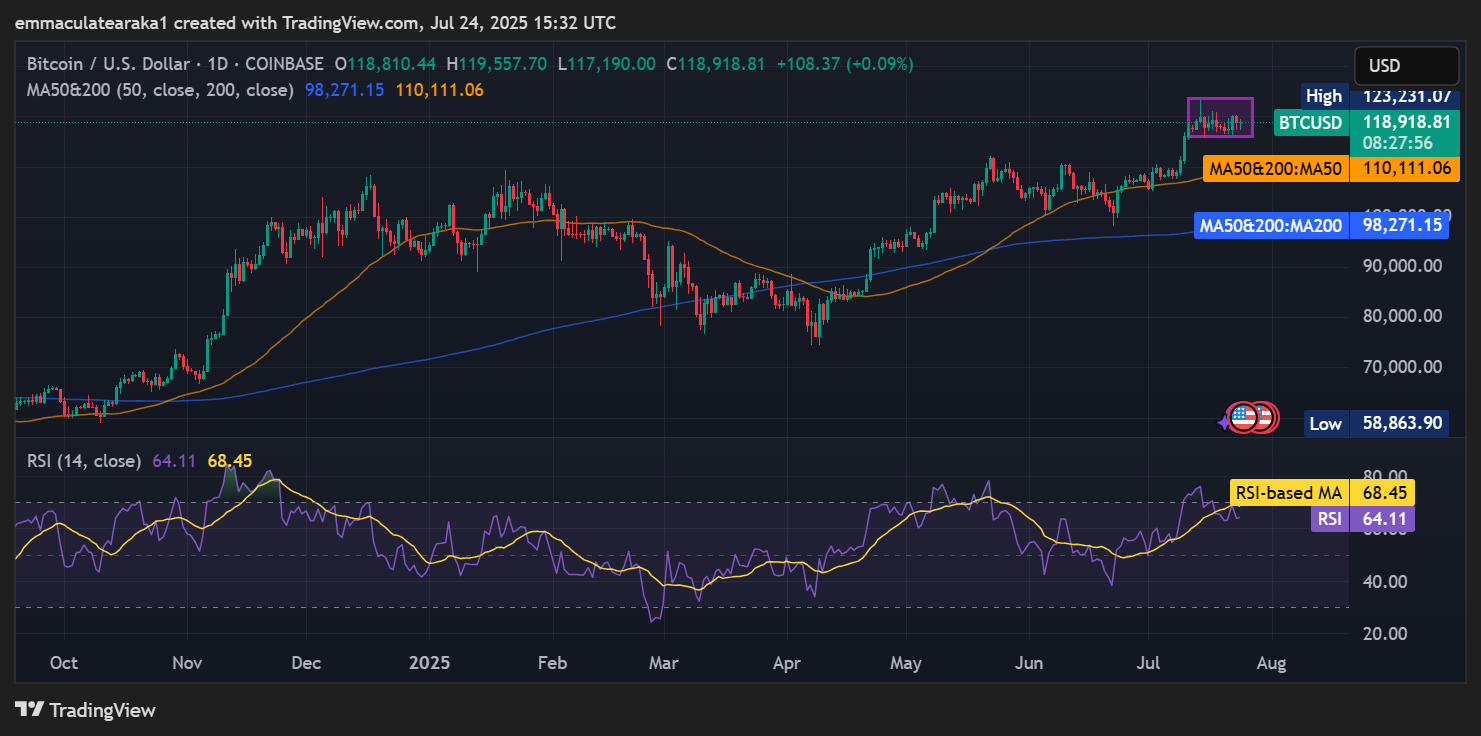
On the other hand, the Relative Strength Index (RSI) stands at 64.11, indicating that the currency is not yet overbought. Nevertheless, as can be observed on the chart, the RSI-based MA Bitcoin has been increasingly approaching the overbought area, where it has already reached 68.45. This suggests that Bitcoin is approaching a significant resistance level. If the RSI shifts upward, Bitcoin can reach overbought levels, and its value may decline if the momentum of purchases fades.
BTC Bulls Aim for a Rally to $140K
The Bitcoin price has strong support at $110,111 (50-day SMA), and if that breaks, it could drop to around $107K. A deeper floor sits at $98,271, coinciding with the 200-day SMA. In the short term, if adoption grows, BTC could rise to $130,000–$140,000 by August. With clear regulations now in place, $150,000 by year-end is possible—unless an unexpected event crashes the market. Meanwhile, investors should watch the RSI. If it goes above 70, it might be time to take profits.
![]()
eToro Platform
Best Crypto Exchange
- Over 90 top cryptos to trade
- Regulated by top-tier entities
- User-friendly trading app
- 30+ million users
![]()
eToro is a multi-asset investment platform. The value of your investments may go up or down. Your capital is at risk. Don’t invest unless you’re prepared to lose all the money you invest. This is a high-risk investment, and you should not expect to be protected if something goes wrong.
Advertisement


