
Highlights
- Aevo (AEVO) surged 6.2% in 24 hours to $0.3997, with trading volume increasing 85% to $135 million, raising its market cap to $352 million.
- AEVO is consolidating in a triangle pattern, indicating a potential breakout; traders should monitor resistance levels and volume.
- Bullish indicators, including a rising MACD and an RSI of 62.78, suggest an uptrend toward $1.266, with $0.35 as key support.
The Aevo price has surged 6.2% in the last 24 hours to trade at $0.3997 as of 2.30 a.m. EST, fueled by an 85% pump in trading volume to $135 million. Now, the market capitalization stands at $352 million.
Advertisement

Approaching the decision point, AEVO is continuing to consolidate within the triangle, signaling that the breakout could be imminent. The trader should be keen enough to watch any spike in volume and price behavior around the resistance. The coming days are going to be crucial and will tell whether the market breaks out or faces a rejection.
#AEVO 🚀 Ready for a 361% Surge?#AEVOUSDT is showing signs of a massive breakout from a descending channel. Trading at $0.351, this setup suggests a stunning 361.86% upside potential, targeting $1.266.
👀💲Deal details : 👇 $AEVOhttps://t.co/5si43Q6MFL pic.twitter.com/3yZXxSDyOv
— Million from Scratch (@TheWizardDi) October 17, 2024
According to analyst Million from Scratch, AEVO price is showing strong potential for a breakout from a descending channel. Currently trading at $0.351, the setup indicates a possible surge of 361.89%, with an ambitious target price of $1.266.
The chart highlights a breakout scenario, and if confirmed by an increase in trading volume and momentum, this move could result in substantial gains. Traders are advised to monitor price action closely as the market approaches this critical point.
AEVO Statistics
- Aevo price: $0.3997
- Market Capitalization: $352 million
- Trading volume: $135 million
- Circulating supply: 881 million
- Total supply: 1 billion
Aevo Price Signals a Bullish Breakout: Can the Bulls Sustain the Momentum
The AEVO/USD price action indicates a consolidation, creating a solid support line close to $0.35, shown by the orange horizontal line. The sideways movement signifies that over the last months, no clear direction was in sight; nonetheless, on-chain metrics propose a likely beginning of a bullish turn. It has just now broken above the 50-day moving average-a key short-term indicator that often marks the beginning of upward momentum- currently set at about $0.355.
Meanwhile, the 200-day moving average is higher at around $0.738 and still reflects a longer-term bearish trend. In other words, the broader trend has not turned fully bullish yet, but this recent price action may be an early sign of change.
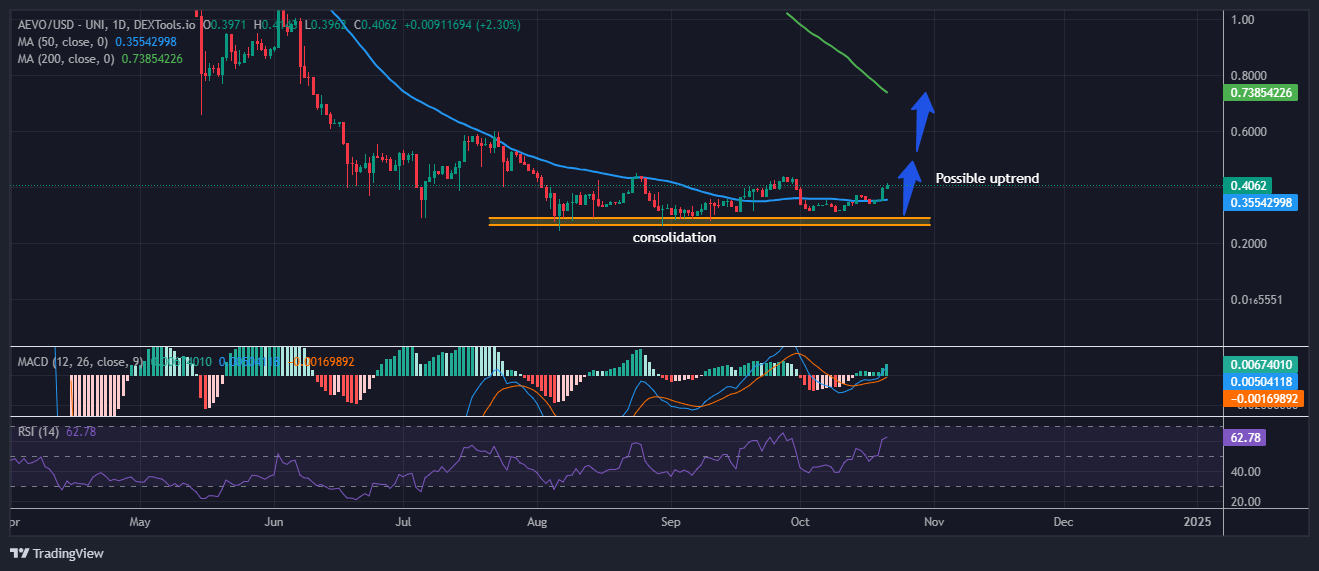
Regarding technical indicators, the MACD exhibits an increasing bullish bias-the color of the histogram is green. Besides, the line itself is very close to crossing above the signal line, which would absolutely ensure the robustness of this uptrend.
The RSI reads 62.78, which suggests that while the market is gaining buying interest for the Aevo price, it has not reached overbought levels yet. This suggests that further upside action may dominate before reaching a likely resistance level.
The blue arrows on the chart highlight a potential upside breakout towards higher prices as long as this upward pressure is maintained. The first formidable resistance in sight is close to the 200-day moving average at $0.738. On the support side, consolidation around $0.35 is an important area of support.
The real test, however, will be seen if the price approaches the 200-day moving average at approximately $0.738. A move through this could see a more significant uptrend. Having said that, the $0.35 support is still paramount, as a break below could invalidate the bullish bias. The market, for now, looks set to achieve a break above, but one has to see how the price reacts at key resistance points.
Advertisement