Customize Consent Preferences

We use cookies to help you navigate efficiently and perform certain functions. You will find detailed information about all cookies under each consent category below.

The cookies that are categorized as "Necessary" are stored on your browser as they are essential for enabling the basic functionalities of the site. ... 

Always Active

Necessary cookies are required to enable the basic features of this site, such as providing secure log-in or adjusting your consent preferences. These cookies do not store any personally identifiable data.

No cookies to display.

Functional cookies help perform certain functionalities like sharing the content of the website on social media platforms, collecting feedback, and other third-party features.

No cookies to display.

Analytical cookies are used to understand how visitors interact with the website. These cookies help provide information on metrics such as the number of visitors, bounce rate, traffic source, etc.

No cookies to display.

Performance cookies are used to understand and analyze the key performance indexes of the website which helps in delivering a better user experience for the visitors.

No cookies to display.

Advertisement cookies are used to provide visitors with customized advertisements based on the pages you visited previously and to analyze the effectiveness of the ad campaigns.

No cookies to display.

bitcoin
Bitcoin (BITCOIN)
$95,038 0.11%
ethereum
Ethereum (ETHEREUM)
$1,810 0.19%
binancecoin
BNB (BINANCECOIN)
$600.03 -0.67%
solana
Solana (SOLANA)
$148.76 0.85%
ripple
XRP (RIPPLE)
$2.21 -1.97%
shiba-inu
Shiba Inu (SHIBA-INU)
$0.000013 -0.96%
pepe
Pepe (PEPE)
$0.000009 0.23%
bonk
Bonk (BONK)
$0.000019 -3.28%
Disclosure
Cryptocurrency trading is speculative and your capital is at risk when you trade. We may earn affiliate commissions from some of the products on this page - at no extra cost to you.
Celestia Price Surges 2% as Volume and Open Interest Increase: What's Next?

Highlights:

  • Celestia’s price has surged 9% in a week as bulls aim to propel the price high.
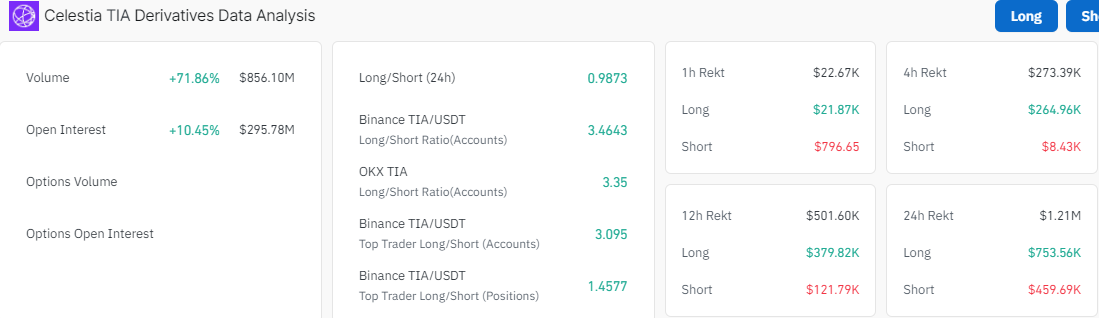
  • Volume and Open interest have elevated, indicating growing investor confidence in the token.
  • Analyst predicts TIA could rally to $8 in the short term. 

The Celestia price has surged 2% today, with the TIA/USD trading at $5.90. The noticeable price movement is accompanied by an increase in its 24-hour trading volume of 51% to $167.99 million. TIA is now up 9% in a week, 13% in a month, and a whopping 182% in a year, gaining a spot among the fastest-growing tokens in the crypto sphere.

Advertisement

Banner

Moreover, Coinglass data upholds a bullish outlook in the Celestia market as the volume and open interest surge. The Open Interest (OI) in TIA is up 10% to $295.78M, while the volume has surged 71.86% to $856.10M. This indicates renewed interest in the token as investors’ confidence bolsters.

Source: Coinglass

On the other hand, traders and investors are optimistic about the token, as the analyst aims for a movement between $8 and $10 soon.

Celestia Statistical Data

Based on CoinmarketCap data:

  • TIA price now – $5.90
  • Trading volume (24h) – $167.99 Million
  • Market cap – $1.29 billion
  • Total supply – 1.08 billion
  • Circulating supply – 218.19 million 
  • TIA ranking – #57

On September 30, the TIA price dwindled mercilessly like a dead weight in the air as the bulls established strong support at $4.77, cushioning against further losses. This led to the bulls building momentum in the market, causing a rally.

However, recently, the asset encountered resistance at $6.25, leading to a decline. This has resulted in the formation of a rounding bottom pattern in the Celestia market. This bearish momentum raises concerns about a further drop, potentially targeting the support level of $5.62. 

Meanwhile, the TIA price trades well above key moving averages, including the 50-day Simple Moving average and 200-day SMA. The bulls have established immediate support at $5.51 and 5.62, tilting the odds in favor of the buyers. 

Celestia price
TIA/USD 4-hour chart: Dextools.io

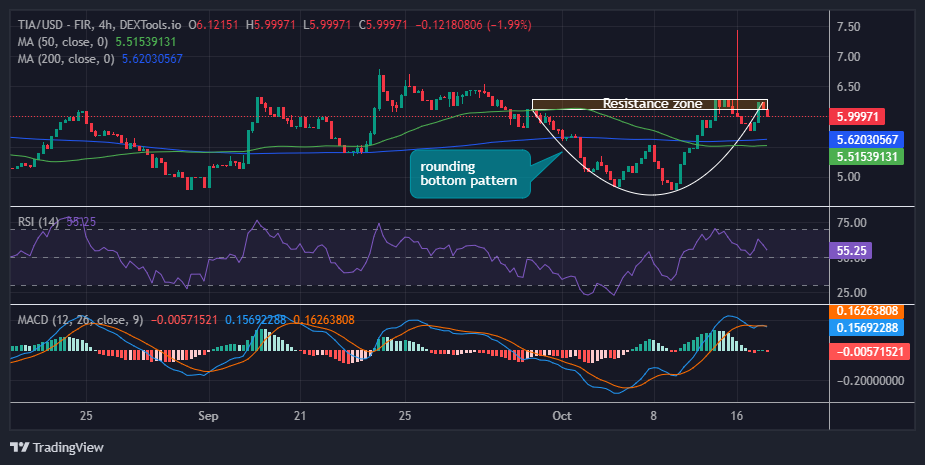
Moreover, the Relative Strength Index (RSI) sits at the 55.25 level, suggesting increased buying pressure. In this case, if the bulls increase their buying appetite, the RSI could jump to the 70-overbought zone in the short term. However, if the bears step into the market as the momentum indicator (RSI) is pointing downwards, the RSI could drop below the 50-mean level, invalidating the bullish thesis.

On the other side of the fence, the Moving Average Convergence Divergence (MACD) introduces a new bearish outlook on the four-hour chart. A sell signal manifested when the blue MACD line flipped below the orange signal line, revealing that declines should be expected in the Celestia market.

Celestia Price Prediction: Which Direction Is TIA Heading?

The Celestia price is showing some mixed reactions in the 4-hour chart timeframe as both the bulls and bears struggle to take control. However, if the bulls capitalize on the RSI, which shows intense buying pressure, the TIA price could surge. Moreover, if the support levels stay intact, the TIA price could soar, targeting the next technical barrier at $6.80.

On the flip side, with the MACD indicator upholding a sell signal, the TIA price could drop. In such a case, the $5.62 support level would be in line to absorb the selling pressure. A breach and break below the support zone will cause the price to dwindle to $5.51, coinciding with the 50-day SMA. 

Advertisement

Banner

Advertisement

Banner

Advertisement

Banner