


Highlights
- PEPE rose 3% to $0.00001043 with $1.75B in trading volume, fueled by whale activity.
- A breakout from a bearish channel signals a potential rally, targeting $0.0000016 if the momentum continues.
- Fed rate cuts and Trump’s pro-crypto support could drive PEPE to $0.000020 by November.
The Pepe price has surged 3% in the last 24 hours to trade at $0.00001043 as of 3:15 a.m. EST on a 1.5% increase in trading volume to $1.75 billion. now the market capitalization stands at $4.3 billion.
Advertisement

There’s strong demand for PEPE right now, with trading volume hitting $1.7 billion and some serious whale activity, like a recent buy of 101 billion PEPE. This ongoing accumulation hints that PEPE could jump to $0.000010 in the next day or two.
A whale withdrew 101.8B $PEPE($1.01M) and 83.36B $SHIB($1.48M) from #Binance in the past 20 minutes.
The whale currently holds 964.17B $PEPE($9.53M) and 456.62B $SHIB($8.07M).https://t.co/OcWKqsL14L pic.twitter.com/xH1PpvaPkr
— Lookonchain (@lookonchain) October 11, 2024
In the bigger picture, things are looking promising. The market is getting a boost from Fed rate cuts and the pro-crypto vibe around Donald Trump’s campaign, which could send PEPE up to $0.000020 by the end of November. Pepe, a meme coin based on Ethereum, has surged fantastically in 2024 – up 1400% YTD in price and growing from a market capitalization of less than $100M to over $4.3B as of October.
$PEPE When a symmetrical triangle breakout occurs, expect a massive bullish wave🚀#PEPE #PEPEUSDT #Crypto pic.twitter.com/C0oj3mFNSp
— ZAYK Charts (@ZAYKCharts) October 14, 2024
According to ZAYK Charts, Pepe is approaching a bullish breakout that could extend rallies in the cryptocurrency. For the moment, the coin changes hands 39% below its ATH of $0.00001718, but growing trading volume could point to an uptrend.
PEPE Statistics
- Pepe price: $0.00001043
- Market capitalization:$4.3 billion
- Trading volume:$1.75 billion
- circulating supply: 420.69 trillion
- Total supply: 420.69 trillion
Pepe Price Breakout from Bearish Channel Signals Potential Bullish Reversal
The interesting technical setup of the PEPE/USDT chart consists of a downtrend within a bearish channel from early May through late September. This downward movement, respecting the channel’s boundary, broke out in October. This breakout above the descending channel indicates a possible reversal from the downtrend, probably marking the beginning of a new bullish phase.
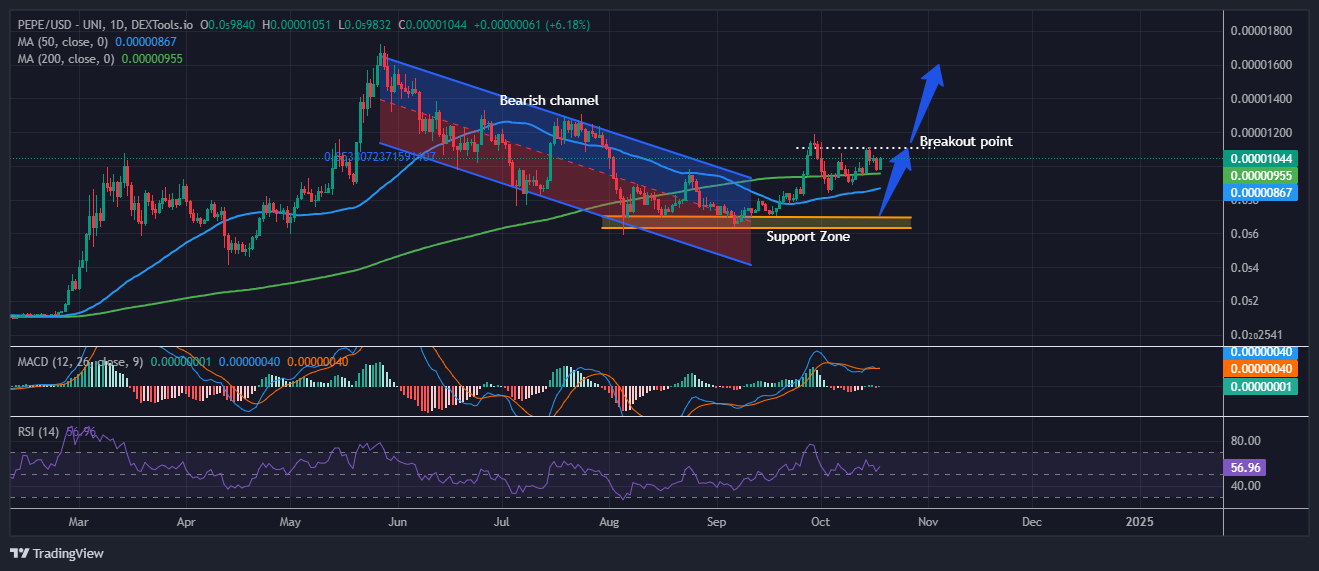
The price has found strong support within the zone between $0.00000072 and $0.00000078, a zone that has continually preventing further downside, allowing the price to stage a recovery.
Additionally, the moving averages provide more insight as the 50-day moving average, currently at $0.000000867, is acting as a dynamic support. Meanwhile the 200-day moving average, around $0.000000955, is close to the current price and could, therefore, act as resistance. If the price manages to remain above the 200-day MA, this might confirm the breakout to the upside.
Key Resistance at $0.0000012 Could Spark Next Rally
Talking indicators, the MACD shows the MACD line crossing above the signal line, while green histogram bars confirm the growing bullish momentum. The RSI (relative strength index) is at 56.96, which shows a slightly bullish sentiment but is not overbought at this level. Hence, there is more room for upward movement for the Pepe price.
In the short term, the price is expected to test the $0.0000012 resistance level. If the breakout holds and the price moves above this level with strong buying volume, we could see the price heading toward the next target of $0.0000016.
However, if the price fails to break above $0.0000012, it may consolidate or pull back, potentially retesting the support zone between $0.00000072 and $0.00000078. As long as this support is in place, the bullish scenario will remain intact. Traders should watch for a confirmed close above the 200-day moving average (around $0.000000955 ) as a sign of continued strength. The coming days are critical for sustaining bullish momentum or facing a price retracement.
Advertisement


