
The Pepe price has retraced slightly after hitting an intra-day high of $0.00001 on October 7. The frog-themed meme coin is bleeding, as it has plunged 9%, with the PEPE/USD trading at $0.0000095 at press time. Its 24-hour trading volume has notably plummeted 18% to $1.09 billion, indicating a recent fall in market activity. Pepe is now down 12% in a week, despite a surge of 39% in a month and a 1243% increase in a year.
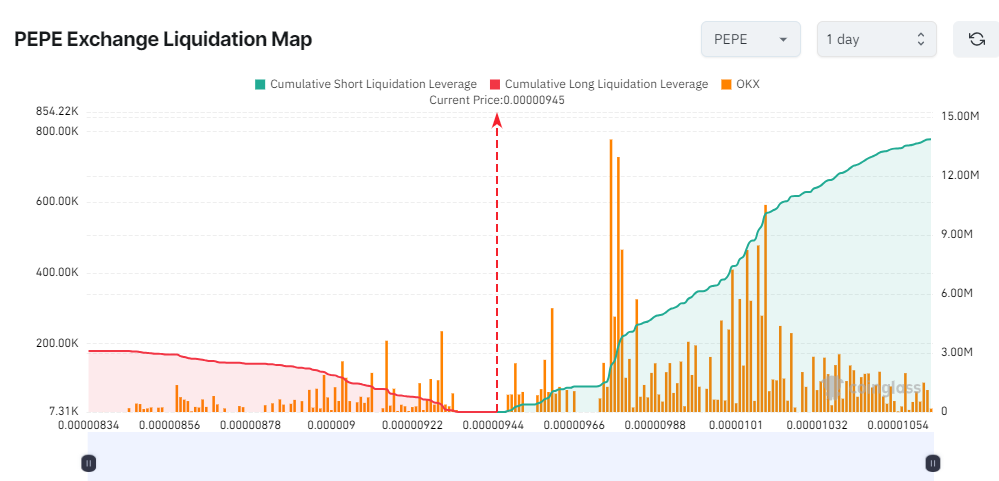
Meanwhile, according to Coinglass data, the Pepe exchange liquidation hitmap in the past 24 hours signals some bearish prospects. This is evident as the short liquidation leverages are comparably higher than the long liquidation leverages. This signals that traders and investors are closing their positions or lack confidence in Pepe’s price direction.
Advertisement

Pepe Statistical Data
Based on CoinmarketCap data:
- PEPE price now – $0.0000095
- Trading volume (24h) – $1.09 billion
- Market cap – $4.04 billion
- Total supply – 420.69 trillion
- Circulating supply – 420.69 trillion
- PEPE ranking – #25
Selling pressure is mounting in the Pepe market as bears mercilessly dwindle the PEPE price. However, as predicted earlier, this was expected as the bulls retreated in search of enough liquidity. This has resulted in the formation of a rising channel, with the bears testing the lower trendline of the governing channel.
Technical Indicators Suggest Potential Downside in the Pepe Market
The frog-themed meme coin price is hovering around the $0.0000095 support level, with the bears quashing the buying pressure in the market. However, certain key levels would determine PEPE’s direction, starting with the confluence resistance formed at $0.0000097 by the 50-day Simple Moving Average (SMA) (green) and the channel’s middle boundary.
The Relative Strength Index (RSI) depicts some bearish prospects. The RSI is currently holding below the 50 mid-line level, heading towards the 30-oversold zone. Currently, it sits at 43.35, suggesting increased selling pressure. If the buyers don’t step in at this level, the RSI could dwindle to the 30-oversold region, reinforcing the bearish sentiment.
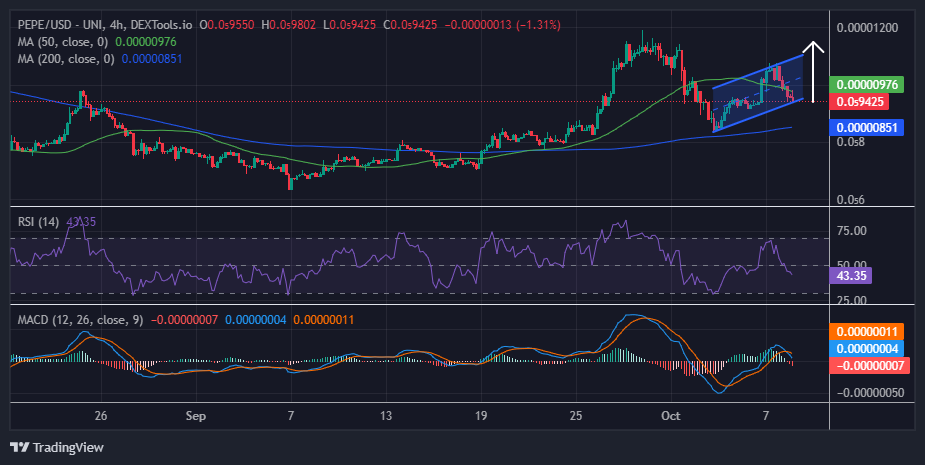
Furthermore, the Moving Average Convergence Divergence (MACD) upholds a bearish outlook. The MACD line (blue) has flipped below the orange signal line, meaning the Pepe price is falling in bearish sentiment. Additionally, the green histograms are diminishing as the MACD line hovers toward the negative territory(below the 0.000 mean level). It is prudent to note that as the momentum indicator gradually ascends above the mean line (0.00) into the positive region, the path with the least resistance stays on the upside.
Can the Pepe Bulls Gain Momentum?
Based on the technical information from the 4-hour chart above, the Pepe bulls are nowhere to be seen, as the bears control the market. Meanwhile, the bears have retested the lower trendline of the governing channel and breached the support level at $0.0000099, coinciding with the 50-day SMA.
On the downside, increased selling pressure will see the frog-themed meme coin dwindle, retesting the $0.0000091 support. In a highly bearish scenario, the support at $0.0000085, coinciding with the 200-day SMA, will be in line to absorb further losses.
On the other hand, if the bulls step in and capitalize on the 200-day SMA, which acts as immediate support, the meme coins price will surge. On the upside, if the $0.0000085 support holds, the Pepe price will retest the $0.00001 mark in the short term. The Pepe price would jump to $0.000015 in a highly bullish scenario.
Advertisement