

Aptos price has surged by 3% in the last 24 hours to trade at $8.07 as of 4:55 a.m. EST, on a 16% plunge in trading volume to $514 million. The market cap is now at $4 billion.
Layer 1 blockchain network Aptos announced it has acquired Japanese blockchain developer HashPalette, expanding into Japan’s blockchain market. Aptos Labs, the company behind the Aptos Network, bought HashPalette Inc., a subsidiary of HashPort Inc. and developer of the Palette blockchain, as part of a strategic move into Japan.
Advertisement

BIG NEWS: We've agreed to acquire @hashpalette_en, the pioneers behind Japan's Palette Chain! This is a game-changer for Japan & the Aptos ecosystem. 🌏
This underscores our commitment to Japan, supercharging their booming digital economy with @Aptos cutting-edge tech ⚡🌐 pic.twitter.com/NjAYhT7ez1
— Aptos Labs (@AptosLabs) October 3, 2024
Aptos Labs said that HashPalette, which has partnerships with several Japanese firms, will migrate its Palette Chain and applications to the Aptos Network by early 2025. Holders of Palette Chain’s governance token, PLT, can exchange it for APT, though the details are yet to be clarified.
The integration is set to be completed before Expo 2025 in Osaka, where Aptos will be the exclusive blockchain supporting the event’s digital wallet system. According to the announcement, this partnership will allow Expo participants to interact with non-fungible tokens (NFTs), digital assets, and decentralized applications using Aptos’ infrastructure.
Aptos Statistics
- Aptos price: $8.07
- Market cup: $4 billion
- Trading volume: $514 million
- Circulating supply: 502 million
- Total supply: 1.1 billion
Aptos Price Bullish Sentiment Continues Remaining Strong
Aptos price has faced considerable pressure, with bears nearly driving the price down to a support level of $7.97. However, once the price reached this support zone, the bulls regained control, pushing the price upward. This movement indicates a potential bullish breakout, suggesting that the market may be shifting from a bearish to a bullish trend despite the bears trying to regain control of the Apto price.
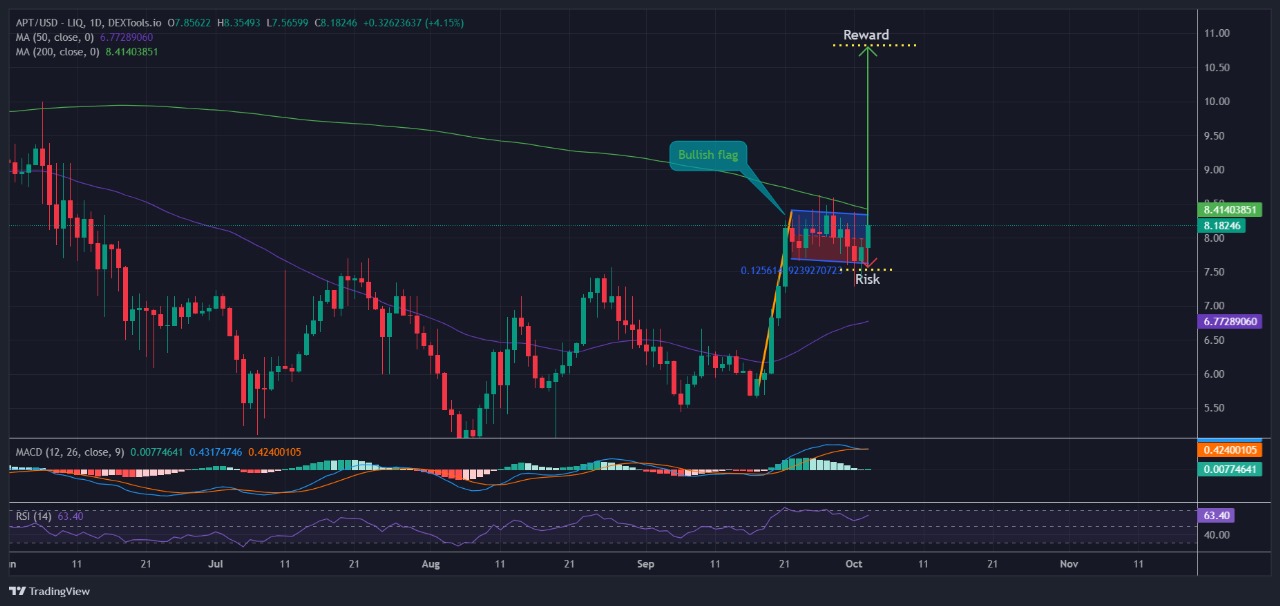
The daily chart displays strong indications of a potential bullish crossover. The market is trading above the 50-day simple moving average (SMA), climbing toward the 200-day SMA. A successful breach above the 200-day SMA would enhance the likelihood of a bullish crossover signal. Should the bulls continue to push the price significantly above these SMAs, it would solidify the overall bullish trend.
Bullish Technicals Signal Bullish Trend Continuation
The Relative Strength Index (RSI) also supports the upcoming bully rally. The RSI is currently holding above the 50 mid-line level and is forming a slight uptrend towards the 70-overbought zone. A rise above the 70-overbought level would signal strong increased buying pressure and further validate the bullish sentiment. If the RSI manages to surpass the 70-overbought level and continues rising, the market will create a new all-time high.
Additionally, the Moving Average Convergence Divergence (MACD) offers further evidence of a potential bullish crossover. The green histogram bars are seen increasing in number. On the other hand, the blue line is seen holding above the orange signal line. This confluence of indicators suggests an increased probability of a significant bullish crossover and a strengthening market trend.
The bulls demonstrate a significant strength by driving the price down after regrouping at the $7.97 support level. They aim to continue pushing the market higher, targeting a price of $10. On the other hand, if the bears manage to maintain their momentum, they could pull the price to $7.53, which would benefit the sellers.
Advertisement


