The Graph price is winning on the charts today, as it has surged 2%, with the GRT/USD trading at $0.1857 at press time. Accompanying the price movement is its 24-hour trading volume, which has soared by 1% to $63 million, suggesting increased market activity. The Graph price has now escaped the red zone, up 20% in a week, 18 % in a month, and a whopping 116% in a year.
The graph continues to establish itself as a fundamental pillar for decentralized applications (dApps) infrastructure. Its innovative indexing protocol allows developers to efficiently organize and access data from various blockchains, making it an indispensable tool within the Web3 ecosystem. This ability to facilitate real-time data management has increased its adoption in numerous decentralized projects.
Advertisement

Recently, the Graph announced enhanced support for Solana, featuring a new tutorial on how to index Solana with a Substreams-powered subgraph.
ICYMI: The Graph announced enhanced support for Solana last week ✨
Want to start querying @solana data today?
⬇️ Checkout this video tutorial by @Marcus_Rein_ from @GraphDevs on how to index Solana with a Substreams-powered subgraph. pic.twitter.com/W9ln9cKVBB
— The Graph (@graphprotocol) September 24, 2024
Moreover, the project has positioned itself as an essential component in the blockchain world, attracting more developers and increasing the number of applications integrating its technology.
The Graph Statistical Data
Based on CoinmarketCap data:
- GRT price now – $0.1857
- Trading volume (24h) – $63 million
- Market cap – $1.77 billion
- Total supply – 10 billion
- Circulating supply – 9.54 billion
- GRT ranking – #51
How High Can the GRT Price Go?
The Graph price has secured a spot, surging 40% from its low on September 18. The massive breakout over the past few days has led to the formation of a rising channel in the GRT market. Meanwhile, in the 4-hour chart timeframe, the bulls have completely taken the reigns, leaving the bears with nothing but dust.
Flipping to the technical information, the Graph price trades well above the key moving averages, including the 50-day Simple Moving Average (SMA) (green) and the 200-day (blue), allowing bulls to stay in control. In this case, the bulls have established strong support at $0.1507, coinciding with the 200-day, and $0.1665, coinciding with the 50-day. The bulls have cleared the seller congestion, leaving the GRT price in a resistance-free zone.
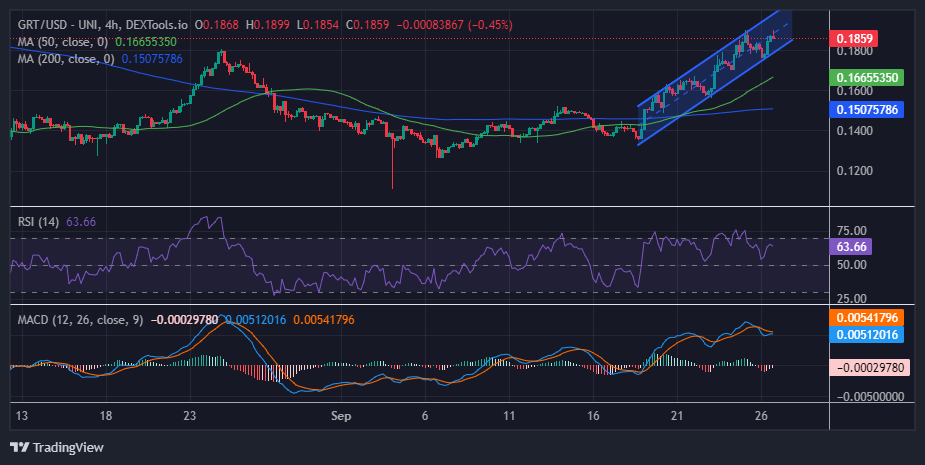
Furthermore, the Relative Strength Index sits well above the 50-mean level at 63.66. This suggests that the buying pressure is surging, with the bulls targeting the 70-overbought zone. In such a case, if the RSI steps above the 70 level, traders won’t have to worry about sudden pullbacks, as the bulls will slightly retrace in search of enough liquidity before a substantial upswing.
On the other hand, the Moving Average Convergence Divergence (MACD) introduces a new bearish outlook on the four-hour chart. A sell signal has manifested as the blue MACD line flipped below the orange signal line, revealing that declines should be expected before the GRT price rebounds. In other words, traders will be inclined to sell unless the blue MACD line flips above the orange signal line.
The Graph Price Outlook
In the 4-hour chart above, the bulls have the reigns. However, based on the MACD, which suggests a sell signal, it might culminate in a reversal. Moreover, it is prudent to carefully watch out for the RSI’s rejection from the overbought region to time the reversal and avoid the bull trap. In such a case, the GRT price might experience a slight correction.
However, the support provided by the 50-day SMA at $0.1665 would be instrumental in absorbing the selling pressure. On the other hand, if the bulls gather enough liquidity, they may trigger an upswing, sending the GRT price to the moon. The GRT price may target the $0.4 mark in such a scenario.
Advertisement